
MATLAB: An Introduction with Applications
6th Edition
ISBN: 9781119256830
Author: Amos Gilat
Publisher: John Wiley & Sons Inc
expand_more
expand_more
format_list_bulleted
Related questions
Question
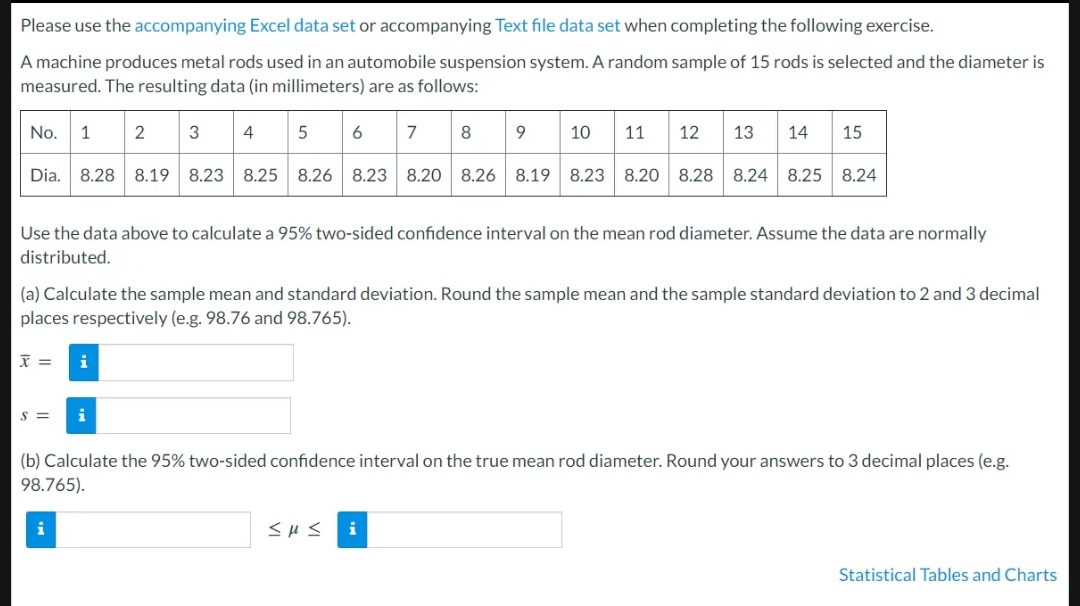

Transcribed Image Text:Please use the accompanying Excel data set or accompanying Text file data set when completing the following exercise.
A machine produces metal rods used in an automobile suspension system. A random sample of 15 rods is selected and the diameter is
measured. The resulting data (in millimeters) are as follows:
No.
2
3 4
6
7
9.
10
11
12
13
14
15
Dia.
8.28
8.19 8.23
8.25
8.26 8.23
8.20 8.26 8.19 8.23 8.20
8.28 8.24 8.25 8.24
Use the data above to calculate a 95% two-sided confidence interval on the mean rod diameter. Assume the data are normally
distributed.
(a) Calculate the sample mean and standard deviation. Round the sample mean and the sample standard deviation to 2 and 3 decimal
places respectively (e.g. 98.76 and 98.765).
i
S =
(b) Calculate the 95% two-sided confidence interval on the true mean rod diameter. Round you
answers to 3 decimal places (e.g.
98.765).
i
Statistical Tables and Charts
Expert Solution
This question has been solved!
Explore an expertly crafted, step-by-step solution for a thorough understanding of key concepts.

Step by stepSolved in 3 steps

Knowledge Booster

Similar questions
- Use the given data values (a sample of female arm circumferences in centimeters) to identify the corresponding z scores that are used for a normal quantile plot, then identify the coordinates of each point in the normal quantile plot. Construct the normal quantile plot, then determine whether the data appear to be from a population with a normal distribution. 33.9, 37.9, 43.8, 32.8, 40.1 Question content area bottom Part 1 List the z scores for the normal quantile plot. Part A -List the z scores for the normal quantile plot. Part B- Identify the coordinates of each point in the normal quantile plot. Use ordered pairs for the form (x,y), where x is the sorted arm circumferences in ascending order, and y is the corresponding z score. Part C- Do the data come from a normally distributed population?arrow_forward8arrow_forwardPlease help me in answering the following practice question:Given a random sample of the amount of protein (in gram) in one bag of snack food: 0.95, 0.85, 0.92, 0.95, 0.93, 0.86, 1, 0.92, 0.85, 0.81, 0.78, 0.93, 0.93, 1.05, 0.93, 1.06, 1.06, 0.96, 0.81, 0.96 Here, it is assumed that the amount of protein in the snack is normal. How would I calculate a 98% two-sided confidence interval for the average amount of protein in one bag?Thank you for your help in advance!arrow_forward
- Tornadoes The following data represent the width (inyards) and length (in miles) of tornadoes.Width (yards), w Length (miles), L200 2.5350 4.8180 2.0300 2.5500 5.8400 4.5500 8.0800 8.0100 3.450 0.5700 9.0600 5.7Source: NOAA(a) Draw a scatter diagram of the data, treating width as theindependent variable.(b) What type of relation appears to exist between the widthand the length of tornadoes?(c) Select two points and find a linear model that containsthe points.(d) Graph the line on the scatter diagram drawn in part (b).(e) Use the linear model to predict the length of a tornadothat has a width of 450 yards.(f) Interpret the slope of the line found in part (c).arrow_forwardDetermine Px and ox from the given parameters of the population and sample size. μ = 62, o = 24, n = 35 = ...arrow_forwardDraw the normal curve using the data given b. x = 83. s = 6 a.x = 30. s = 8 %3Darrow_forward
- Consider the population of all laptop computers owned by students at your university. You want to know the weight of the laptop. (a) Specify the population unit. (b) Specify the variable of interest. (c) Specify the statistical population.arrow_forwardSee picture of table attached to answer, thank you Garrison Bay is a small bay in Washington state. A popular recreational activity in the bay is clam digging. For several years, this harvest has been monitored and the size distribution of clams recorded. Data for lengths and widths of littleneck clams (Protothaca staminea) were recorded by a method of systematic sampling in a study done by S. Scherba and V. F. Gallucci"The Application of Systematic Sampling to a Study of lnfaunal Variation in a Soft Substrate Intertidal Environment," Fishery Bulletin, Vol. 74, pp. 937-948). The data in Tables 8-4 and 8-5 give lengths and widths for 35 littleneck clams. (a) Use a calculator to compute the sample mean and sample standard deviation for the lengths and widths. Compute the coefficient of variation for each. (b) Compute a 95% confidence interval for the population mean length of all Garrison Bay littleneck clams. (c) How many more littleneck clams would be needed in a…arrow_forward
arrow_back_ios
arrow_forward_ios
Recommended textbooks for you
- MATLAB: An Introduction with ApplicationsStatisticsISBN:9781119256830Author:Amos GilatPublisher:John Wiley & Sons Inc
 Probability and Statistics for Engineering and th...StatisticsISBN:9781305251809Author:Jay L. DevorePublisher:Cengage Learning
 Statistics for The Behavioral Sciences (MindTap C...StatisticsISBN:9781305504912Author:Frederick J Gravetter, Larry B. WallnauPublisher:Cengage Learning
  Elementary Statistics: Picturing the World (7th E...StatisticsISBN:9780134683416Author:Ron Larson, Betsy FarberPublisher:PEARSON
 The Basic Practice of StatisticsStatisticsISBN:9781319042578Author:David S. Moore, William I. Notz, Michael A. FlignerPublisher:W. H. Freeman
 Introduction to the Practice of StatisticsStatisticsISBN:9781319013387Author:David S. Moore, George P. McCabe, Bruce A. CraigPublisher:W. H. Freeman
MATLAB: An Introduction with Applications
Statistics
ISBN:9781119256830
Author:Amos Gilat
Publisher:John Wiley & Sons Inc
Probability and Statistics for Engineering and th...
Statistics
ISBN:9781305251809
Author:Jay L. Devore
Publisher:Cengage Learning
Statistics for The Behavioral Sciences (MindTap C...
Statistics
ISBN:9781305504912
Author:Frederick J Gravetter, Larry B. Wallnau
Publisher:Cengage Learning
Elementary Statistics: Picturing the World (7th E...
Statistics
ISBN:9780134683416
Author:Ron Larson, Betsy Farber
Publisher:PEARSON
The Basic Practice of Statistics
Statistics
ISBN:9781319042578
Author:David S. Moore, William I. Notz, Michael A. Fligner
Publisher:W. H. Freeman
Introduction to the Practice of Statistics
Statistics
ISBN:9781319013387
Author:David S. Moore, George P. McCabe, Bruce A. Craig
Publisher:W. H. Freeman