
MATLAB: An Introduction with Applications
6th Edition
ISBN: 9781119256830
Author: Amos Gilat
Publisher: John Wiley & Sons Inc
expand_more
expand_more
format_list_bulleted
Related questions
Question
thumb_up100%
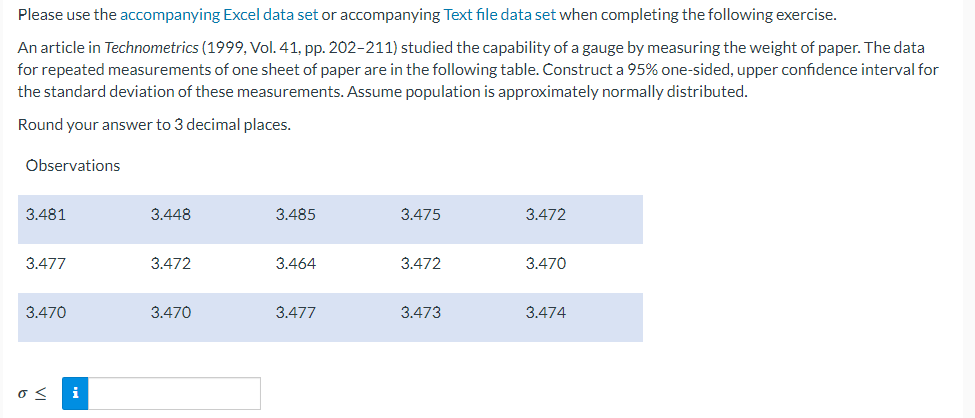

Transcribed Image Text:Please use the accompanying Excel data set or accompanying Text file data set when completing the following exercise.
An article in Technometrics (1999, Vol. 41, pp. 202-211) studied the capability of a gauge by measuring the weight of paper. The data
for repeated measurements of one sheet of paper are in the following table. Construct a 95% one-sided, upper confidence interval for
the standard deviation of these measurements. Assume population is approximately normally distributed.
Round your answer to 3 decimal places.
Observations
3.481
3.477
3.470
o< i
3.448
3.472
3.470
3.485
3.464
3.477
3.475
3.472
3.473
3.472
3.470
3.474
Expert Solution
This question has been solved!
Explore an expertly crafted, step-by-step solution for a thorough understanding of key concepts.

This is a popular solution

Trending nowThis is a popular solution!

Step by stepSolved in 5 steps with 13 images

Knowledge Booster

Similar questions
- Students investigating the packaging of potato chips purchased 6bags of chips marked with a net weight of 28.1 grams. They carefully weighed the contents of each bag, recording the following weights (in grams): 29.2, 28.1, 29.2, 28.6, 28.7, 28.7. Complete parts a through c below. a) Do these data satisfy the assumptions for inference? Explain. b) Find the mean and standard deviation of the weights. (round to two decimal places) c) Create a 95% confidence interval for the mean weight of such bags of chips. (round to one decimal place)arrow_forwardA potato chip company wants to evaluate the accuracy of its potato chip bag-filling machine. Bags are labeled as containing 8 ounces of potato chips. A simple random sample of 12 bags had mean weight 7.82 ounces with a sample standard deviation of 0.013 ounce. Assume the weights are approximately normally distributed. Construct a 90% confidence interval for the population mean weight of bags of potato chips. Round the answers to at least two decimal places. The 90% confidence interval isarrow_forwardAnswer part carrow_forward
- 1. Do you think the gamma distribution is a reasonable model for the data? What are the relevant considerations? Summarize your thoughts and conclusion(s) in 2-3 sentences. 2. Determine a way to estimate the bias of 0 under the gamma model. Does it seem large in context? 3. Refer to the attached data table. The ôH column reports estimated standard deviations for each measurement. How might you use these to estimate varH? Sketch out an approach by listing a few steps, and explain your reasoning. Supernova data from Freedman et al. Supernova ID SN19900 Velocity (km/sec) Н (km/sec/Mрс) Distance (Mpc) 9065.00 134.70 67.30 2.30 SN1990T SN1990af 12012.00 158.90 75.60 3.10 15055.00 198.60 75.80 2.80 16687.00 69.80 83.70 SN1991S 238.90 2.80 SN1991U 9801.00 117.10 3.40 SN1991ag SN1992J 4124.00 56.00 73.70 2.90 13707.00 183.90 74.50 3.10 SN1992P 7880.00 121.50 64.80 2.20 SN1992ae 22426.00 274.60 81.60 3.40 SN1992ag SN1992al SN1992aq SN1992au SN1992bc 7765.00 102.10 76.10 2.70 4227.00 58.00 72.80…arrow_forwardpart b pleasearrow_forwardI need help with this problem.arrow_forward
- Part 1 of 3 A researcher was investigating the size of math departments in Texas colleges. She believed the population standard deviation was 1.9. A sample of 42 colleges found their mean was 12.5. Find the 3-decimal small value of the 95% confidence interval of the mean. Part 2 of 3: Find the 3-decimal large value of the 95% confidence interval of the mean. Part 3 of 3: Find the 3-decimal margin of errorarrow_forwardIt is a well-known fact that 40% of college students LOVE taking Mathematics. A certain professor at WCC wanted to test to see if a majority of students at WCC LOVE taking Mathematics. To test this, the professor randomly samples 1000 students and finds that 515 of them LOVE taking Mathematics.At the 0.05 level of significance, does the above sample provide evidence to suggest a majority of students at WCC LOVE taking Mathematics? Step 1: Define the parameter & setup the testStep 2: State the Level of SignificanceStep 3: Find the value of the Test StatisticsStep 4: Find P-Value OR Find Critical ValueStep 5: State Conclusion and whyarrow_forwardRepeated baseline measurements help improve the ____ of a single-subject study. A.Ecological validity B. Generalizability C. Internal validity D. Sample's representativenessarrow_forward
- A STATISTICS PROFESSOR IS REVIEWING GRADES TREAT THE SCHEDULE AS UNGROUPED DATA GRADE 86 76 96 86 92 82 74 76 85 81 88 GRADE 90 86 76 74 85 92 85 76 83 84 95 SOLVE FOR UNGROUPED DATA- MEASURES OF CENTRAL TENDENCY, QUARTILES. SAMPLE STANDARD DEVIATION RANGE INTERQUARTILE RANGE SOLVE BOTH WAYSarrow_forwardA company that develops an automated customer service model is interested in knowing whether two versions, Version A and Version B, will get different ratings from customers. Participants in a focus group are taken through samples from both versions, then take a survey to rate each version. A summary of the data obtained from the study is given below. Assume ratings from the different surveys generally have the same standard deviation. Mean Observations Pearson Correlation Hypothesized Mean Difference df t Stat P(T<=t) one-tail t Critical one-tail P(T<=t) two-tail t Critical two-tail Confidence Level Version A Version B 33.133 28.67 15 15 -0.325 0.00 14 n = Ex: 9 -1.426 0.088 -1.345 0.176 -1.761 95% Degrees of freedom: df Point estimate for Version A: XA = Ex: 1.234 Point estimate for Version B: x B = 1 = من t = −1 Ex: 1.234 0 1 t = P = = Ex: 1.234 2 3 2arrow_forward
arrow_back_ios
arrow_forward_ios
Recommended textbooks for you
- MATLAB: An Introduction with ApplicationsStatisticsISBN:9781119256830Author:Amos GilatPublisher:John Wiley & Sons Inc
 Probability and Statistics for Engineering and th...StatisticsISBN:9781305251809Author:Jay L. DevorePublisher:Cengage Learning
 Statistics for The Behavioral Sciences (MindTap C...StatisticsISBN:9781305504912Author:Frederick J Gravetter, Larry B. WallnauPublisher:Cengage Learning
  Elementary Statistics: Picturing the World (7th E...StatisticsISBN:9780134683416Author:Ron Larson, Betsy FarberPublisher:PEARSON
 The Basic Practice of StatisticsStatisticsISBN:9781319042578Author:David S. Moore, William I. Notz, Michael A. FlignerPublisher:W. H. Freeman
 Introduction to the Practice of StatisticsStatisticsISBN:9781319013387Author:David S. Moore, George P. McCabe, Bruce A. CraigPublisher:W. H. Freeman
MATLAB: An Introduction with Applications
Statistics
ISBN:9781119256830
Author:Amos Gilat
Publisher:John Wiley & Sons Inc
Probability and Statistics for Engineering and th...
Statistics
ISBN:9781305251809
Author:Jay L. Devore
Publisher:Cengage Learning
Statistics for The Behavioral Sciences (MindTap C...
Statistics
ISBN:9781305504912
Author:Frederick J Gravetter, Larry B. Wallnau
Publisher:Cengage Learning
Elementary Statistics: Picturing the World (7th E...
Statistics
ISBN:9780134683416
Author:Ron Larson, Betsy Farber
Publisher:PEARSON
The Basic Practice of Statistics
Statistics
ISBN:9781319042578
Author:David S. Moore, William I. Notz, Michael A. Fligner
Publisher:W. H. Freeman
Introduction to the Practice of Statistics
Statistics
ISBN:9781319013387
Author:David S. Moore, George P. McCabe, Bruce A. Craig
Publisher:W. H. Freeman