MATLAB: An Introduction with Applications
6th Edition
ISBN: 9781119256830
Author: Amos Gilat
Publisher: John Wiley & Sons Inc
expand_more
expand_more
format_list_bulleted
Question

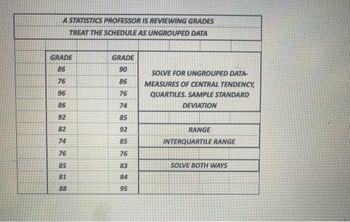
Transcribed Image Text:A STATISTICS PROFESSOR IS REVIEWING GRADES
TREAT THE SCHEDULE AS UNGROUPED DATA
GRADE
86
76
96
86
92
82
74
76
85
81
88
GRADE
90
86
76
74
85
92
85
76
83
84
95
SOLVE FOR UNGROUPED DATA-
MEASURES OF CENTRAL TENDENCY,
QUARTILES. SAMPLE STANDARD
DEVIATION
RANGE
INTERQUARTILE RANGE
SOLVE BOTH WAYS
Expert Solution
This question has been solved!
Explore an expertly crafted, step-by-step solution for a thorough understanding of key concepts.
Step by stepSolved in 3 steps with 3 images

Knowledge Booster
Similar questions
- A group of friends get together every Sunday for a little pick-up hockey. The age of the 20 regulars is shown below. 21 25 26 46 28 22 42 38 22 38 49 44 55 33 45 31 24 43 25 37 Find the mean, median, and mode for the distribution (ungrouped data). Which measure best describes these data? Explain. Group these data into six intervals and produce a frequency table. Determine the mean, and median for a new set of grouped data.arrow_forwardPlease answer all thoroughly and clearly Grade 12 Data Managementarrow_forwardConsider the following sample data. Sample A: 5, 8, 11 Sample B: 64, 67, 70 Sample C: 1,015; 1,018; 1,021 (a) Find the mean and standard deviation for each sample. (b) What does this exercise show about the standard deviation? multiple choice The idea is to illustrate that the standard deviation is not a function of the value of the mean. The idea is to illustrate that the standard deviation is a function of the value of the mean.arrow_forward
- The full question didn't fit in one part so I attached 2 photos.arrow_forwardWhich is the largest with regard to the following data set: the range or the standard deviation? 11 11 12 12 12 12 13 15 17 22 22 22 Standard Deviation Rangearrow_forward_________ are used to display actual data points for individual-level data. Would this answer be Univariate Statistics?arrow_forward
- Which one of the following summary statistics best matches the data on the abundance of various bird species shown here? Frequency (No. species) 25 20 15 10 5 0 0 Mean = Mean = Mean = 100 200 300 400 500 600 Abundance (No. individuals) 75 individuals, s.d. = 122 individuals 300 individuals, s.d. = 14871 individuals 10 individuals, s.d. = 10 individuals Mean = 10 individuals, s.d. = 14871 individuals Mean 75 individuals, s.d. = 14871 individualsarrow_forwardThe histogram below shows the ages (in years) of Honda Civic automobiles listed for sale on the Seattle Times Web site on November 26, 2003. 20 15 10 2 4 6 8 10 12 14 16 18 Age (years) Which of the following terms apply to this histogram? (Select all that apply.) O negatively skewed(to the left) O uniform O symmetric O bimodal O unimodal O positively skewed(to the right) Which measure of center is most appropriate for this data? O median O mean Which measure of spread is most appropriate for this data? O standard deviation M # of carsarrow_forwardWhich of the following five statistics are commonly used together to determine the shape of a distribution? Five answers correct. All or nothing credit. 1. The minimum 2. Variance 3. The 2nd quartile 4. The maximum 5. Coefficient of variation 6. Interquartile range 7. The 1st quartile 8. The 3rd quartile 9. Range 10. Standard deviationarrow_forward
- I need an APA write up description of the descriptives of this data set of the number of male and females who preferred hamburgers or hot dogs. (EXAMPLE: “The total sample was n=…, demographic breakup is ......The mean was...the Standard Deviation was…”) etc.arrow_forwardHere is a FDT for a small data set: data freq 25 3 26 4 27 2 28 4 29 7 Find the following measures of central tendency.mean = median = mode =arrow_forward
arrow_back_ios
arrow_forward_ios
Recommended textbooks for you
 MATLAB: An Introduction with ApplicationsStatisticsISBN:9781119256830Author:Amos GilatPublisher:John Wiley & Sons Inc
 Probability and Statistics for Engineering and th...StatisticsISBN:9781305251809Author:Jay L. DevorePublisher:Cengage Learning
 Statistics for The Behavioral Sciences (MindTap C...StatisticsISBN:9781305504912Author:Frederick J Gravetter, Larry B. WallnauPublisher:Cengage Learning
 Elementary Statistics: Picturing the World (7th E...StatisticsISBN:9780134683416Author:Ron Larson, Betsy FarberPublisher:PEARSON
 The Basic Practice of StatisticsStatisticsISBN:9781319042578Author:David S. Moore, William I. Notz, Michael A. FlignerPublisher:W. H. Freeman
 Introduction to the Practice of StatisticsStatisticsISBN:9781319013387Author:David S. Moore, George P. McCabe, Bruce A. CraigPublisher:W. H. Freeman

MATLAB: An Introduction with Applications
Statistics
ISBN:9781119256830
Author:Amos Gilat
Publisher:John Wiley & Sons Inc

Probability and Statistics for Engineering and th...
Statistics
ISBN:9781305251809
Author:Jay L. Devore
Publisher:Cengage Learning

Statistics for The Behavioral Sciences (MindTap C...
Statistics
ISBN:9781305504912
Author:Frederick J Gravetter, Larry B. Wallnau
Publisher:Cengage Learning

Elementary Statistics: Picturing the World (7th E...
Statistics
ISBN:9780134683416
Author:Ron Larson, Betsy Farber
Publisher:PEARSON

The Basic Practice of Statistics
Statistics
ISBN:9781319042578
Author:David S. Moore, William I. Notz, Michael A. Fligner
Publisher:W. H. Freeman

Introduction to the Practice of Statistics
Statistics
ISBN:9781319013387
Author:David S. Moore, George P. McCabe, Bruce A. Craig
Publisher:W. H. Freeman