
Practical Management Science
6th Edition
ISBN: 9781337406659
Author: WINSTON, Wayne L.
Publisher: Cengage,
expand_more
expand_more
format_list_bulleted
Related questions
Concept explainers
Question
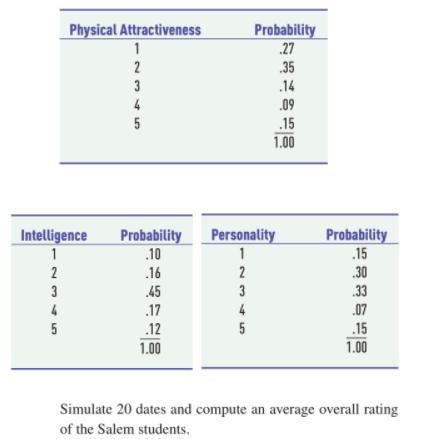
Randolph College and Salem College are within 20 miles
of each other, and the students at each college frequently
date. The students at Randolph College are debating how
good their dates are at Salem College. The Randolph
students have sampled several hundred of their fellow
students and asked them to rate their dates from 1 to 5
(where 1 is excellent and 5 is poor) according to physical
attractiveness, intelligence, and personality. Following are
the resulting probability distributions for these three traits:

Transcribed Image Text:Physical Attractiveness
Probability
.27
1
35
3
.14
4
.09
.15
1.00
Personality
Intelligence
1
Probability
.10
Probability
.15
1
2
.16
2
.30
3
.45
3
33
4
.17
4
.07
.15
1.00
5
.12
1.00
Simulate 20 dates and compute an average overall rating
of the Salem students.
2344
Expert Solution
This question has been solved!
Explore an expertly crafted, step-by-step solution for a thorough understanding of key concepts.

This is a popular solution

Trending nowThis is a popular solution!

Step by stepSolved in 2 steps with 1 images

Knowledge Booster


Learn more about
Need a deep-dive on the concept behind this application? Look no further. Learn more about this topic, operations-management and related others by exploring similar questions and additional content below.Similar questions
- A manager intends to order a new machine and must now decide on the number of spare parts to order along with the machine. The parts cost $496 each and have no salvage value. The manager has compiled the frequency distribution for the probable usage of spare parts:7 spare parts with frequency 0.05;8 spare parts with frequency 0.23;9 spare parts with frequency 0.08;10 spare parts with frequency 0.07; and 11 spare parts with frequency 0.57. For what range of shortage costs would stocking 9 spare parts constitute an optimal decision ? a. Between 231.5and 334.8 b. Between 192.9and 279 c. Between 289.3and 418.5 d. Between 96.44and 139.5arrow_forward10 Dr. Lillian Fok, a New Orleans psychologist, specializes in treating patients who are agoraphobic (i.e., afraid to leave their homes). The following table indicates how many patients Dr. Fokh each year for the past 10 years. It also indicates what the robbery rate was in New Orleans during the same year: ! 1 F1 A 1 option Year Number of Patients Robbery Rate per 1,000 Population The simple linear regression equation that shows the best relationship between the number of patients and the robbery rate is (round your responses to three decimal places): ŷ=0+0x N @ 2 W S X command A where y Number of Patients and x = Robbery Rate. In year 11, if the robbery rate increases to 133.40, using trend analysis, the number of patients Dr. Fok will see = patients (round your response to two decimal places). In year 11, if the robbery rate decreases to 90.6, using trend analysis, the number of patients Dr. Fok will see = patients (round your response to two decimal places). #3 80 F3 E D $ 4 C 888…arrow_forwardCafé Michigan's manager, Gary Stark, suspects that demand for mocha latte coffees depends on the price being charged. Based on historical observations, Gary has gathered the following data, which show the numbers of these coffees sold over six different price values: Price $2.50 $3.40 $1.90 $4.10 $3.20 $4.00 Number Sold 770 510 975 240 315 475 Using simple linear regression and given that the price per cup is $1.75, the forecasted demand for mocha latte coffees will be (enter your response rounded to one decimal place). cupsarrow_forward
- Café Michigan's manager, Gary Stark, suspects that demand for mocha latte coffees depends on the price being charged. Based on historical observations, Gary has gathered the following data, which show the numbers of these coffees sold over six different price values: Price $2.60 $3.50 $1.90 $4.10 $3.00 $4.00 Number Sold 760 515 990 245 320 480 D Using simple linear regression and given that the price per cup is $1.80, the forecasted demand for mocha latte coffees will be to one decimal place). cups (enter your response roundedarrow_forwardA company hires you to develop a linear regression forecasting model. Based on the company's historical sales information, you determine the intercept value of the model to be 1,500. You also find the slope value is -25. If after developing the model you are given a value of X = 8, which of the following is the resulting forecast error using this model if the actual sales is 1250?arrow_forwardA salesperson uses three different airlines. The probabilities of switching from one airline to another in consecutive flights are shown below. If the last flight was on Delta, what is the probability that the next was on American? American Delta Southwest American 0.5 0.25 0.25 Delta 0.2 0.6 0.2 Southwest 0.3 0.3 0.4 A 0.5 B 0.2 C 0.25 D 0.6arrow_forward
- Café Michigan's manager, Gary Stark, suspects that demand for mocha latte coffees depends on the price being charged. Based on historical observations, Gary has gathered the following data, which show the numbers of these coffees sold over six different price values: Price $2.70 $3.50 $2.10 $4.10 $3.10 $4.05 Number Sold 765 515 990 245 320 480 Using simple linear regression and given that the price per cup is $1.85, the forecasted demand for mocha latte coffees will be cups (enter your response rounded to one decimal place).arrow_forwardThe University of Miami bookstore stocks textbooks in preparation for sales each semester. It normally relies on departmental forecasts and preregistration records to determine how many copies of a text are needed. Preregistration shows 85 operations management students enrolled, but bookstore manager Vaidy Jayaraman has second thoughts, based on his intuition and some historical evidence. Vaidy believes that the distribution of sales may range from 65 to 85 units, according to the following probability model: Demand Probability 65 0.10 Stock 70 0.30 65 This textbook costs the bookstore $82 and sells for $112. Any unsold copies can be returned to the publisher, less a restocking fee and shipping, for a net refund of $30. a) Based on the given information, Vaidy's conditional profits table for the bookstore is: 65 p=0.10 75 0.20 70 p=0.30 80 0.10 Demand 75 p=0.20 80 p = 0.10 85 p=0.30 85 0.30arrow_forwardNarrow_forward
- A company wants to forecast demand using the weighted moving average. If the company uses three prior yearly sales values (i.e., the year 2014 = 155, the year 2015 = 140 and year 2016 = 170), and we want to weight the year 2014 at 30%, the year 2015 at 35% and year 2016 at 40%, which of the following is the weighted moving average forecast for the year 2017? 170 158 O 164 O 160arrow_forwardCafé Michigan's manager, Gary Stark, suspects that demand for mocha latte coffees depends on the price being charged. Based on historical observations, Gary has gathered the following data, which show the numbers of these coffees sold over six different price values: IT Price Number Sold $2.60 $3.60 $2.00 $4.20 $3.10 $4.00 770 505 975 250 315 490 Using simple linear regression and given that the price per cup is $1.85, the forecasted demand for mocha latte coffees will be cups (enter your response rounded to one decimal place).arrow_forwardA company that produces protein bars used differentforecasting techniques to predict demand for its proteinbars. The actual demand and the forecasted demand forcases of protein bats using the two different forecasting methods are presented in the following table:Month F1 F2 Actual Demand At1 97 95 992 80 77 863 82 89 904 54 62 685 81 84 796 88 93 827 89 89 968 86 84 889 80 74 76a Compute MAD for the results of each forecastingmethod. Which one is more accurate?b Compute MSE for the results of each forecastingmethod. Which one is more accurate?c Compute MAPE for the results of each forecastingmethod. Which one is more accurate?arrow_forward
arrow_back_ios
SEE MORE QUESTIONS
arrow_forward_ios
Recommended textbooks for you
- Practical Management ScienceOperations ManagementISBN:9781337406659Author:WINSTON, Wayne L.Publisher:Cengage,
 Operations ManagementOperations ManagementISBN:9781259667473Author:William J StevensonPublisher:McGraw-Hill Education
 Operations and Supply Chain Management (Mcgraw-hi...Operations ManagementISBN:9781259666100Author:F. Robert Jacobs, Richard B ChasePublisher:McGraw-Hill Education
 Purchasing and Supply Chain ManagementOperations ManagementISBN:9781285869681Author:Robert M. Monczka, Robert B. Handfield, Larry C. Giunipero, James L. PattersonPublisher:Cengage Learning
 Production and Operations Analysis, Seventh Editi...Operations ManagementISBN:9781478623069Author:Steven Nahmias, Tava Lennon OlsenPublisher:Waveland Press, Inc.
Practical Management Science
Operations Management
ISBN:9781337406659
Author:WINSTON, Wayne L.
Publisher:Cengage,
Operations Management
Operations Management
ISBN:9781259667473
Author:William J Stevenson
Publisher:McGraw-Hill Education
Operations and Supply Chain Management (Mcgraw-hi...
Operations Management
ISBN:9781259666100
Author:F. Robert Jacobs, Richard B Chase
Publisher:McGraw-Hill Education
Purchasing and Supply Chain Management
Operations Management
ISBN:9781285869681
Author:Robert M. Monczka, Robert B. Handfield, Larry C. Giunipero, James L. Patterson
Publisher:Cengage Learning
Production and Operations Analysis, Seventh Editi...
Operations Management
ISBN:9781478623069
Author:Steven Nahmias, Tava Lennon Olsen
Publisher:Waveland Press, Inc.