
MATLAB: An Introduction with Applications
6th Edition
ISBN: 9781119256830
Author: Amos Gilat
Publisher: John Wiley & Sons Inc
expand_more
expand_more
format_list_bulleted
Related questions
Question
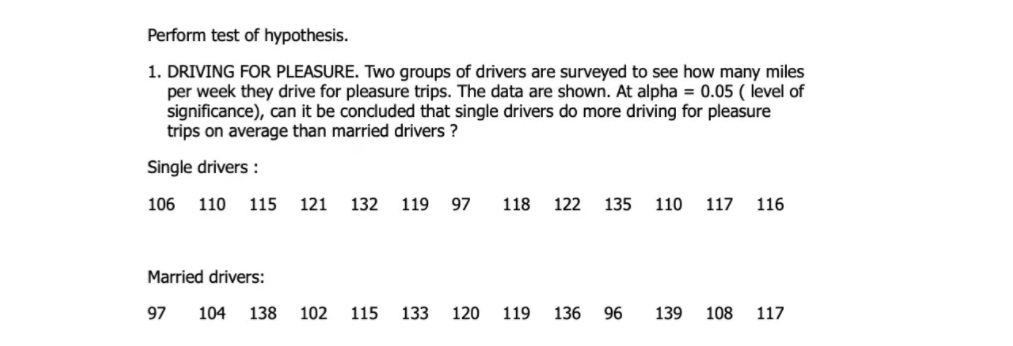

Transcribed Image Text:Perform test of hypothesis.
1. DRIVING FOR PLEASURE. Two groups of drivers are surveyed to see how many miles
per week they drive for pleasure trips. The data are shown. At alpha = 0.05 ( level of
significance), can it be concluded that single drivers do more driving for pleasure
trips on average than married drivers ?
Single drivers :
106
110
115
121
132 119
97
118
122
135
110
117
116
Married drivers:
97
104 138
102
115
133
120
119
136
96
139
108
117
Expert Solution
This question has been solved!
Explore an expertly crafted, step-by-step solution for a thorough understanding of key concepts.

This is a popular solution

Trending nowThis is a popular solution!

Step by stepSolved in 3 steps with 2 images

Knowledge Booster

Similar questions
- You wish to determine if there is a positive linear correlation between the age of a driver and the number of driver deaths. The following table represents the age of a driver and the number of driver deaths per 100,000. Use a significance level of 0.05 and round all values to 4 decimal places. Driver Age Number of Driver Deaths per 100,000 64 32 55 30 72 36 34 30 31 18 16 29 21 22 32 18 46 24 46 31 Ho: ρ = 0Ha: ρ > 0 Find the Linear Correlation Coefficient r = Find the p-value p-value = The p-value is Greater than αα Less than (or equal to) αα The p-value leads to a decision to Do Not Reject Ho Reject Ho Accept Ho The conclusion is There is a significant linear correlation between driver age and number of driver deaths. There is a significant negative linear correlation between driver age and number of driver deaths. There is a significant positive linear correlation between driver age and number of driver deaths. There is…arrow_forwardA. P value= b. Is the p-value >,< a c. Accept, reject, or hypothesisarrow_forward2. This is a sample of 10 random seasons in the National Hockey League, Wayne Gretzky scored 50% more points than anyone who ever played professional hockey. He accomplished this amazing feat while playing in 280 fewer games than Gordie Howe, the previous record holder. Here are the number of games Gretzky played during each season. 45 70 73 73 74 78 79 80 80 82 e. What is the shape of the data?f. What is the best measure of center and spread to use for this data setarrow_forward
- what is the median numebr of touchdownsarrow_forwardSolve the second onearrow_forwardTest the hypothesis based on the given data. Two groups of drivers were surveyed to see how many miles per week they drive for pleasure trips. The data are shown, a=0.01 Single Drivers Married Drivers 106 110 115 121 132 97 102 115 104 138 | 119 97 118 122 135 133 120 119 136 96 110 117 116 138 142 139 108 117 145 114 | 115 114 113 98 99 140 136 113 113 150 108 117 152 147 117 101 114 116 113 135 154 86 115 116 104 115 109 147 106 88 107 113 138 142 140 113 119 99 108 105 Write the hypotheses for the difference of variances. (Copy and paste this variance symbol for your answer: 8², for variance 1 & 8?, for variance 2) Ho : На: The test was run in MS Excel and generated these results. Single Drivers Maried Drivers Mean 118.9142857 117.8 Variance 261.1983193 257.6941176 Observations 35 35 df 34 34 F 1.013598299 P(F<=f) one-tai F Critical one-tail 0.484409402 2.258266094 What statistical test was used to compare the variances? Conclude about the variances of the two samples. Use the…arrow_forward
- A certain statistics instructor participates in triathlons. The accompanying table lists times (in minutes and seconds) he recorded while riding a bicycle for five laps through each mile of a 3-mile loop. Use a 0.05 significance level to test the claim that it takes the same time to ride each of the miles. Does one of the miles appear to have a hill? LOADING... Click the icon to view the data table of the riding times. Question content area bottom Part 1 Determine the null and alternative hypotheses. H0: ▼ mu 1 greater than mu 2 greater than mu 3μ1>μ2>μ3 mu 1 not equals mu 2 not equals mu 3μ1≠μ2≠μ3 Exactly two of the population means are different from each other.Exactly two of the population means are different from each other. At least one of the three population means is different from the others.At least one of the three population means is different from the others. mu 1 equals mu 2 equals mu 3μ1=μ2=μ3 H1: ▼ mu 1 greater than mu 2…arrow_forwardA lecturer at college wanted to know if he can predict student’s quiz results by asking them tocomplete a simple survey. The result of the survey is given below: Quiz Results EQR Study Hrs Age Sex BBT MB MC AuHS LM 15 10 3 19 0 0 1 1 0 1 14 15 4 24 0 0 1 0 0 1 9 15 1 20 0 10 1 0 0 1 6 10 3 21 0 0 1 1 0 1 14 15 4 21 0 9 1 0 0 1 12 10 6 21 0 2 0 1 0 1 12 13 2 21 1 8 1 0 0 0 15 15 0 20 0 8 1 0 0 1 12 15 3 20 0 10 1 0 0 1 13 15 0.2 19 0 8 1 0 0 1 15 15 2 20 0 6 1 0 1 1 12 14 5 20 0 5 1 1 1 1 14 15 7 22 0 8 0 0 0 0 7 7 10 21 1 7 0 0 1 0 11 15 5 24 0 0 1 0 0 1 10 10 3 22 1 0 1 0 0 1 13 11 3 23 1 1 1 1 1 1 13 15 2 22 1 8 0 0 0 0 13 12 4 20 1 7 1 0 1 0 13 10 3 20 1 0 1 0 0 1 8 13 5 20 1 8 0 0 0 0 12 13 5 22 0 5 0 0 0 1 13 15 8 22 0 5 0 1 0 1 10 13 4 23 1 7 1 0 0 1 13 13 0.5 20 1 0 0 0 0 0 12 13 0.5 20 1 0 1 0 0 0 15 15 2 21 0 10 1 0 0 1 10 13 6 22 0 6 1 1 0 1 11 8 5 20 0 10 0 0 1 0 12 10 4 19 1 0 1 0 0 1 8 5 2 20 1 0 1 0 1 0 11…arrow_forward
arrow_back_ios
arrow_forward_ios
Recommended textbooks for you
- MATLAB: An Introduction with ApplicationsStatisticsISBN:9781119256830Author:Amos GilatPublisher:John Wiley & Sons Inc
 Probability and Statistics for Engineering and th...StatisticsISBN:9781305251809Author:Jay L. DevorePublisher:Cengage Learning
 Statistics for The Behavioral Sciences (MindTap C...StatisticsISBN:9781305504912Author:Frederick J Gravetter, Larry B. WallnauPublisher:Cengage Learning
  Elementary Statistics: Picturing the World (7th E...StatisticsISBN:9780134683416Author:Ron Larson, Betsy FarberPublisher:PEARSON
 The Basic Practice of StatisticsStatisticsISBN:9781319042578Author:David S. Moore, William I. Notz, Michael A. FlignerPublisher:W. H. Freeman
 Introduction to the Practice of StatisticsStatisticsISBN:9781319013387Author:David S. Moore, George P. McCabe, Bruce A. CraigPublisher:W. H. Freeman
MATLAB: An Introduction with Applications
Statistics
ISBN:9781119256830
Author:Amos Gilat
Publisher:John Wiley & Sons Inc
Probability and Statistics for Engineering and th...
Statistics
ISBN:9781305251809
Author:Jay L. Devore
Publisher:Cengage Learning
Statistics for The Behavioral Sciences (MindTap C...
Statistics
ISBN:9781305504912
Author:Frederick J Gravetter, Larry B. Wallnau
Publisher:Cengage Learning
Elementary Statistics: Picturing the World (7th E...
Statistics
ISBN:9780134683416
Author:Ron Larson, Betsy Farber
Publisher:PEARSON
The Basic Practice of Statistics
Statistics
ISBN:9781319042578
Author:David S. Moore, William I. Notz, Michael A. Fligner
Publisher:W. H. Freeman
Introduction to the Practice of Statistics
Statistics
ISBN:9781319013387
Author:David S. Moore, George P. McCabe, Bruce A. Craig
Publisher:W. H. Freeman