MATLAB: An Introduction with Applications
6th Edition
ISBN: 9781119256830
Author: Amos Gilat
Publisher: John Wiley & Sons Inc
expand_more
expand_more
format_list_bulleted
Concept explainers
Question

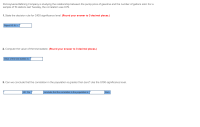
Transcribed Image Text:Pennsylvania Refining Company is studying the relationship between the pump price of gasoline and the number of gallons sold. For a
sample of 15 stations last Tuesday, the correlation was 0.79.
1. State the decision rule for 0.100 significance level. (Round your answer to 3 decimal places.)
Reject H0 if t>
2. Compute the value of the test statistic. (Round your answer to 3 decimal places.)
Value of the test statistic is
3. Can we conclude that the correlation in the population is greater than zero? Use the 0.100 significance level.
HO. We
conclude that the correlation in the population is
Zero.
Expert Solution
This question has been solved!
Explore an expertly crafted, step-by-step solution for a thorough understanding of key concepts.
This is a popular solution
Trending nowThis is a popular solution!
Step by stepSolved in 3 steps with 1 images

Knowledge Booster
Learn more about
Need a deep-dive on the concept behind this application? Look no further. Learn more about this topic, statistics and related others by exploring similar questions and additional content below.Similar questions
- you Created a survey that meawere Depression In people. you want to test the Claim that the Mean. meusurements of Depression that peaple have is not egued to 6.5. A sample. of 145 Of you patients had a mean depression measurement of X=6.7 and a standard deviation of l,5.arrow_forwardhelparrow_forward1. A professor is interested in how attendance is related to grades her class. She goes through her records and determines each student’s final average and the number of days absent. The scores for her sample are given in the table below. a. Construct a scatter plot of the relationship between final averages and the number of days absent. b. Is there a significant relationship between final averages and the number of days absent? Calculate and interpret the correlation and report it in proper APA format. c. Compute r2 for the data. What percent of the variability in final averages is accounted for by the number days absent?arrow_forward
- Please see the picture below. None of the answers I've tried is coming back right. I just need help with the items in the red boxes.arrow_forwardWhat is one indication that there are paired samples in a data set? Choose the correct answer below. O A. Knowing the value that a subject has in one group gives one no information about the value in the second group. OB. Each observation in one group is coupled with one particular observation in the other group. OC. The researcher is comparing two populations. O D. The researcher is working with two distinct groups in the data set.arrow_forwardPlease no written by handarrow_forward
- The average home in the US is expected to cost $240,000. A random sample of 56 homes sold this month showed average price of $232,000. Assume you have access to this data. We are interested in determining cost if the cost of average home has decreased this month. If the test statistic is -1.66 what is the p-value?arrow_forwardAt the .05 significance level, does the data below show significant correlation? x y 3 12.87 4 13.66 5 17.95 6 23.44 7 15.93 8 13.62 9 27.91arrow_forwardHow many sources of between-group variation are measured in a two-way between-subjects ANOVA? Group of answer choices a. 4 b. 2 c. 3 d. 5arrow_forward
- Two social scientists wanted to know if more violent crimes are committed when the temperature goes up. They measured the high temperature for each day during the year in Atlanta and compared the temperature for that day to the Police Department’s report for the number of violent crimes for that day. What statistical test should they use to analyze the data? a. Paired t-test b. Correlation c. One Way ANOVA d. Independent Samples t-test e. Chi Square Test of Independencearrow_forwardPlease answer B, C, & D.arrow_forwardFor scenarios of statistical studies are given below. Decide which study uses a population parameter. And estimated 15% of Americans don't use the Internet. Lakeside family dentistry reported that six of the 15 patients who came in for regular cleaning one day had at least one cavity.arrow_forward
arrow_back_ios
arrow_forward_ios
Recommended textbooks for you
 MATLAB: An Introduction with ApplicationsStatisticsISBN:9781119256830Author:Amos GilatPublisher:John Wiley & Sons Inc
 Probability and Statistics for Engineering and th...StatisticsISBN:9781305251809Author:Jay L. DevorePublisher:Cengage Learning
 Statistics for The Behavioral Sciences (MindTap C...StatisticsISBN:9781305504912Author:Frederick J Gravetter, Larry B. WallnauPublisher:Cengage Learning
 Elementary Statistics: Picturing the World (7th E...StatisticsISBN:9780134683416Author:Ron Larson, Betsy FarberPublisher:PEARSON
 The Basic Practice of StatisticsStatisticsISBN:9781319042578Author:David S. Moore, William I. Notz, Michael A. FlignerPublisher:W. H. Freeman
 Introduction to the Practice of StatisticsStatisticsISBN:9781319013387Author:David S. Moore, George P. McCabe, Bruce A. CraigPublisher:W. H. Freeman

MATLAB: An Introduction with Applications
Statistics
ISBN:9781119256830
Author:Amos Gilat
Publisher:John Wiley & Sons Inc

Probability and Statistics for Engineering and th...
Statistics
ISBN:9781305251809
Author:Jay L. Devore
Publisher:Cengage Learning

Statistics for The Behavioral Sciences (MindTap C...
Statistics
ISBN:9781305504912
Author:Frederick J Gravetter, Larry B. Wallnau
Publisher:Cengage Learning

Elementary Statistics: Picturing the World (7th E...
Statistics
ISBN:9780134683416
Author:Ron Larson, Betsy Farber
Publisher:PEARSON

The Basic Practice of Statistics
Statistics
ISBN:9781319042578
Author:David S. Moore, William I. Notz, Michael A. Fligner
Publisher:W. H. Freeman

Introduction to the Practice of Statistics
Statistics
ISBN:9781319013387
Author:David S. Moore, George P. McCabe, Bruce A. Craig
Publisher:W. H. Freeman