
MATLAB: An Introduction with Applications
6th Edition
ISBN: 9781119256830
Author: Amos Gilat
Publisher: John Wiley & Sons Inc
expand_more
expand_more
format_list_bulleted
Related questions
Concept explainers
Question
Please answer B, C, & D.
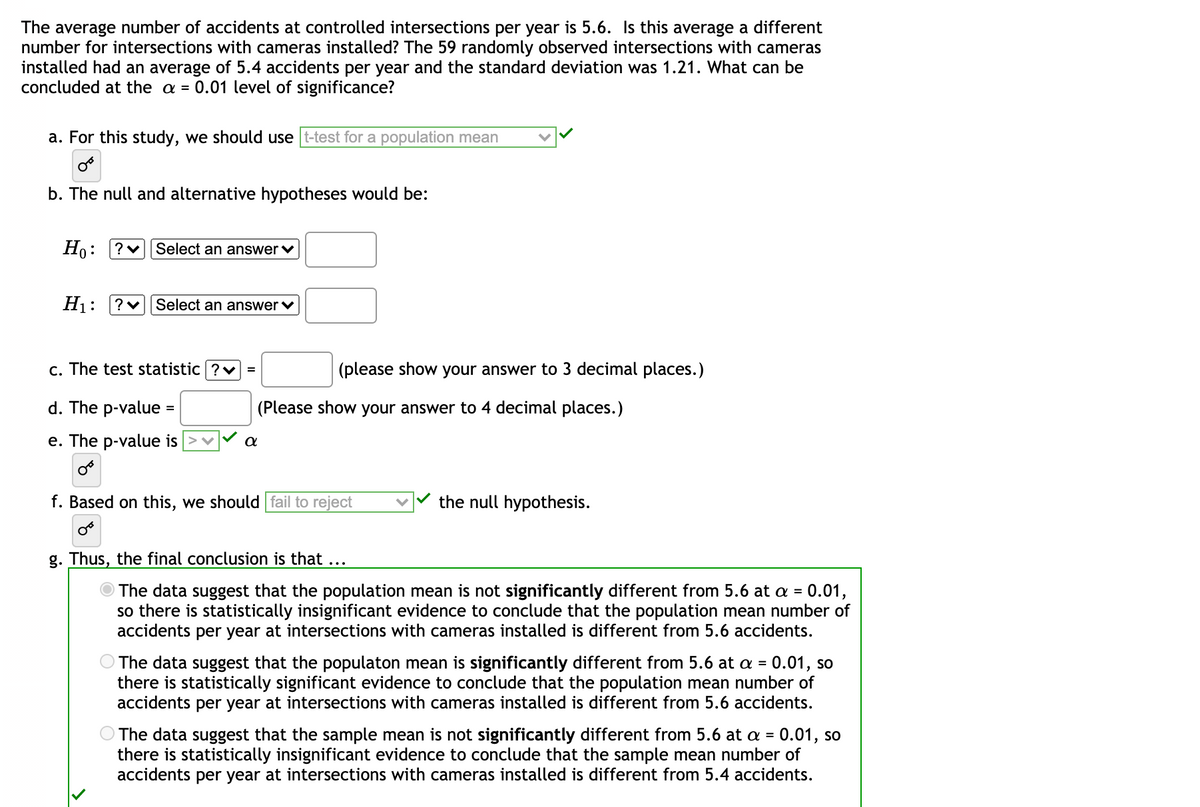

Transcribed Image Text:The average number of accidents at controlled intersections per year is 5.6. Is this average a different
number for intersections with cameras installed? The 59 randomly observed intersections with cameras
installed had an average of 5.4 accidents per year and the standard deviation was 1.21. What can be
concluded at the a = 0.01 level of significance?
a. For this study, we should use t-test for a population mean
b. The null and alternative hypotheses would be:
Ho: ?v Select an answer v
H1:
?v Select an answer v
c. The test statistic ?v =
(please show your answer to 3 decimal places.)
d. The p-value =
(Please show your answer to 4 decimal places.)
e. The p-value is
f. Based on this, we should fail to reject
the null hypothesis.
g. Thus, the final conclusion is that ...
The data suggest that the population mean is not significantly different from 5.6 at a = 0.01,
so there is statistically insignificant evidence to conclude that the population mean number of
accidents per year at intersections with cameras installed is different from 5.6 accidents.
The data suggest that the populaton mean is significantly different from 5.6 at a = 0.01, so
there is statistically significant evidence to conclude that the population mean number of
accidents per year at intersections with cameras installed is different from 5.6 accidents.
O The data suggest that the sample mean is not significantly different from 5.6 at a = 0.01, so
there is statistically insignificant evidence to conclude that the sample mean number of
accidents per year at intersections with cameras installed is different from 5.4 accidents.
%3D
Expert Solution
arrow_forward
Step 1
b.
Let μ denotes the population mean number of accidents at controlled intersections per year. The average number of accidents at controlled intersections per year is 5.3. The claim of test is that there is average different number for intersection with cameras installed. The hypothesis is,
Null hypothesis:
H0:μ=5.6
Alternative hypothesis:
H1:μ≠5.6
The sample size is 59, sample mean is 5.4, sample standard deviation is 1.21.
c.
The test statistic is,
t=ˉx-μ(s√n)=5.4-5.6(1.21√59)=-0.20.1575=-1.270
Thus, the test statistic is t=-1.270.

Step by stepSolved in 2 steps

Knowledge Booster


Learn more about
Need a deep-dive on the concept behind this application? Look no further. Learn more about this topic, statistics and related others by exploring similar questions and additional content below.Similar questions
- Evaluate. OA. + C O B. O C. 9x9 + C O D. 8x7 +Carrow_forwardBelow, n is the sample size, p is the population proportion of successes, and X is the number of successes in the sample. Use the normal approximation and the O Cumulative Normal Distribution Table to find the probability. Round the answer to at least four decimal places. n=78, p=0.43 P (30arrow_forwardPlease helparrow_forward
arrow_back_ios
arrow_forward_ios
Recommended textbooks for you
- MATLAB: An Introduction with ApplicationsStatisticsISBN:9781119256830Author:Amos GilatPublisher:John Wiley & Sons Inc
 Probability and Statistics for Engineering and th...StatisticsISBN:9781305251809Author:Jay L. DevorePublisher:Cengage Learning
 Statistics for The Behavioral Sciences (MindTap C...StatisticsISBN:9781305504912Author:Frederick J Gravetter, Larry B. WallnauPublisher:Cengage Learning
  Elementary Statistics: Picturing the World (7th E...StatisticsISBN:9780134683416Author:Ron Larson, Betsy FarberPublisher:PEARSON
 The Basic Practice of StatisticsStatisticsISBN:9781319042578Author:David S. Moore, William I. Notz, Michael A. FlignerPublisher:W. H. Freeman
 Introduction to the Practice of StatisticsStatisticsISBN:9781319013387Author:David S. Moore, George P. McCabe, Bruce A. CraigPublisher:W. H. Freeman
MATLAB: An Introduction with Applications
Statistics
ISBN:9781119256830
Author:Amos Gilat
Publisher:John Wiley & Sons Inc
Probability and Statistics for Engineering and th...
Statistics
ISBN:9781305251809
Author:Jay L. Devore
Publisher:Cengage Learning
Statistics for The Behavioral Sciences (MindTap C...
Statistics
ISBN:9781305504912
Author:Frederick J Gravetter, Larry B. Wallnau
Publisher:Cengage Learning
Elementary Statistics: Picturing the World (7th E...
Statistics
ISBN:9780134683416
Author:Ron Larson, Betsy Farber
Publisher:PEARSON
The Basic Practice of Statistics
Statistics
ISBN:9781319042578
Author:David S. Moore, William I. Notz, Michael A. Fligner
Publisher:W. H. Freeman
Introduction to the Practice of Statistics
Statistics
ISBN:9781319013387
Author:David S. Moore, George P. McCabe, Bruce A. Craig
Publisher:W. H. Freeman