MATLAB: An Introduction with Applications
6th Edition
ISBN: 9781119256830
Author: Amos Gilat
Publisher: John Wiley & Sons Inc
expand_more
expand_more
format_list_bulleted
Question

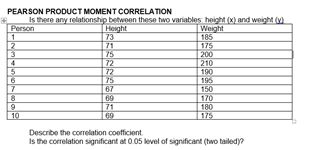
Transcribed Image Text:PEARSON PRODUCT MOMENT CORRELATION
Is there any relationship between these two variables: height (x) and weight (v)
Person
Height
Weight
1
73
185
2
71
175
3
75
200
72
210
72
190
75
196
67
150
69
170
71
180
69
Describe the correlation coefficient
Is the correlation significant at 0.05 level of significant (two tailed)?
4
5
6
7
8
9
10
Expert Solution
This question has been solved!
Explore an expertly crafted, step-by-step solution for a thorough understanding of key concepts.
Step by stepSolved in 2 steps

Knowledge Booster
Similar questions
- Please help thank youarrow_forward2017 JA Azarias is investigating how long his phone's battery lasts (in hours) for various brightness levels (on a scale of 0-100). His data is displayed in the table and graph below. ME Brightness Level (x) www. 41 43 80 98 201 Hours (y) 6.2 3.9 6.5 3.8 swa (1065) Baby Learni... Calculate the correlation coefficient. Round accurately to at least three decimals. Use the correlation coefficient to describe the strength and direction:arrow_forwardPlease answer part B clearly Thanksarrow_forward
- SPSS: Correlation Use SPSS to calculate the appropriate correlation coefficient for the following data for “Hours of Exercise” and “Life Satisfaction.” (0 = Not at all satisfied). Provide an APA-style results section write – up. (b) Graph the relationship. Complete the write-up on a word document and upload the file for submission. Hours of Exercise Life Satisfaction 2 6 0 2 5 13 6 15 1 3 2 6 4 10 4 12 3 8 4 10 APA Template for reporting a Pearson’s Correlation Coefficient You will want to include four main points about your Pearson’s r when communicating results to others. Test type and use You want to tell your reader what type of analysis you conducted. You also want to tell your reader why this particular analysis was used. What did your analysis test for?arrow_forwardCollege Students' Part-Time Weekly Earnings (n = 5) Hours Worked (X) Weekly Pay (Y) 9 103 15 174 19 209 16 152 35 277 a) Calculate SSxx, SSyy, and SSxy. (Leave no cells blank - be certain to enter "0" wherever required. Round your answers to 2 decimal places.) (b) Calculate the sample correlation coefficient. Check your work by using Excel's function =CORREL(array1, array2). (Round your answer to 4 decimal places.) (c) Find t.025 for a two-tailed test for zero correlation at α=0.05α=0.05 . (Round your answer to 3 decimal places.) (d-1) Calculate the t test statistic. (Round your answer to 3 decimal places.) (d-2) Should we reject the null hypothesis of zero correlation? (e) Use Excel's function =T.DIST.2T(t,deg_freedom) to calculate the two-tail p-value. (Round your answer to 4 decimal places.)arrow_forwardA negative value for a correlation indicates____ increase in X tend to be accomplished by the increase in Y how much weaker relationship then if the correlation were positive a much stronger relationship than if the correlation were positive increase in X tend to be accomplished by decrease in Yarrow_forward
- A correlation coefficient measures the strength of the linear relationship between two variables Select one: True False Check The closer the correlation coefficient is to -1 the more spread out the data set is. Select one: True False Check tvarrow_forwardData Bank Hide ( correlation = undefined Show regression line Create a scatterplot with at least 8 points where the correlation is between 0.5 and 0.7 by clicking and dragging points from the Data Bank onto the graph. Enter the correlation coefficient displayed in the applet. correlation coefficient: Now add another data point, in the upper-left corner of the scatterplot. This causes the correlation coefficient Then click and drag this to point down to the lower-left corner of the scatterplot. Take note of this new correlation coefficient and how it changed when you dragged the point down.arrow_forwardThank youarrow_forward
arrow_back_ios
arrow_forward_ios
Recommended textbooks for you
 MATLAB: An Introduction with ApplicationsStatisticsISBN:9781119256830Author:Amos GilatPublisher:John Wiley & Sons Inc
 Probability and Statistics for Engineering and th...StatisticsISBN:9781305251809Author:Jay L. DevorePublisher:Cengage Learning
 Statistics for The Behavioral Sciences (MindTap C...StatisticsISBN:9781305504912Author:Frederick J Gravetter, Larry B. WallnauPublisher:Cengage Learning
 Elementary Statistics: Picturing the World (7th E...StatisticsISBN:9780134683416Author:Ron Larson, Betsy FarberPublisher:PEARSON
 The Basic Practice of StatisticsStatisticsISBN:9781319042578Author:David S. Moore, William I. Notz, Michael A. FlignerPublisher:W. H. Freeman
 Introduction to the Practice of StatisticsStatisticsISBN:9781319013387Author:David S. Moore, George P. McCabe, Bruce A. CraigPublisher:W. H. Freeman

MATLAB: An Introduction with Applications
Statistics
ISBN:9781119256830
Author:Amos Gilat
Publisher:John Wiley & Sons Inc

Probability and Statistics for Engineering and th...
Statistics
ISBN:9781305251809
Author:Jay L. Devore
Publisher:Cengage Learning

Statistics for The Behavioral Sciences (MindTap C...
Statistics
ISBN:9781305504912
Author:Frederick J Gravetter, Larry B. Wallnau
Publisher:Cengage Learning

Elementary Statistics: Picturing the World (7th E...
Statistics
ISBN:9780134683416
Author:Ron Larson, Betsy Farber
Publisher:PEARSON

The Basic Practice of Statistics
Statistics
ISBN:9781319042578
Author:David S. Moore, William I. Notz, Michael A. Fligner
Publisher:W. H. Freeman

Introduction to the Practice of Statistics
Statistics
ISBN:9781319013387
Author:David S. Moore, George P. McCabe, Bruce A. Craig
Publisher:W. H. Freeman