
MATLAB: An Introduction with Applications
6th Edition
ISBN: 9781119256830
Author: Amos Gilat
Publisher: John Wiley & Sons Inc
expand_more
expand_more
format_list_bulleted
Related questions
Question
thumb_up100%
Help please ()()()$
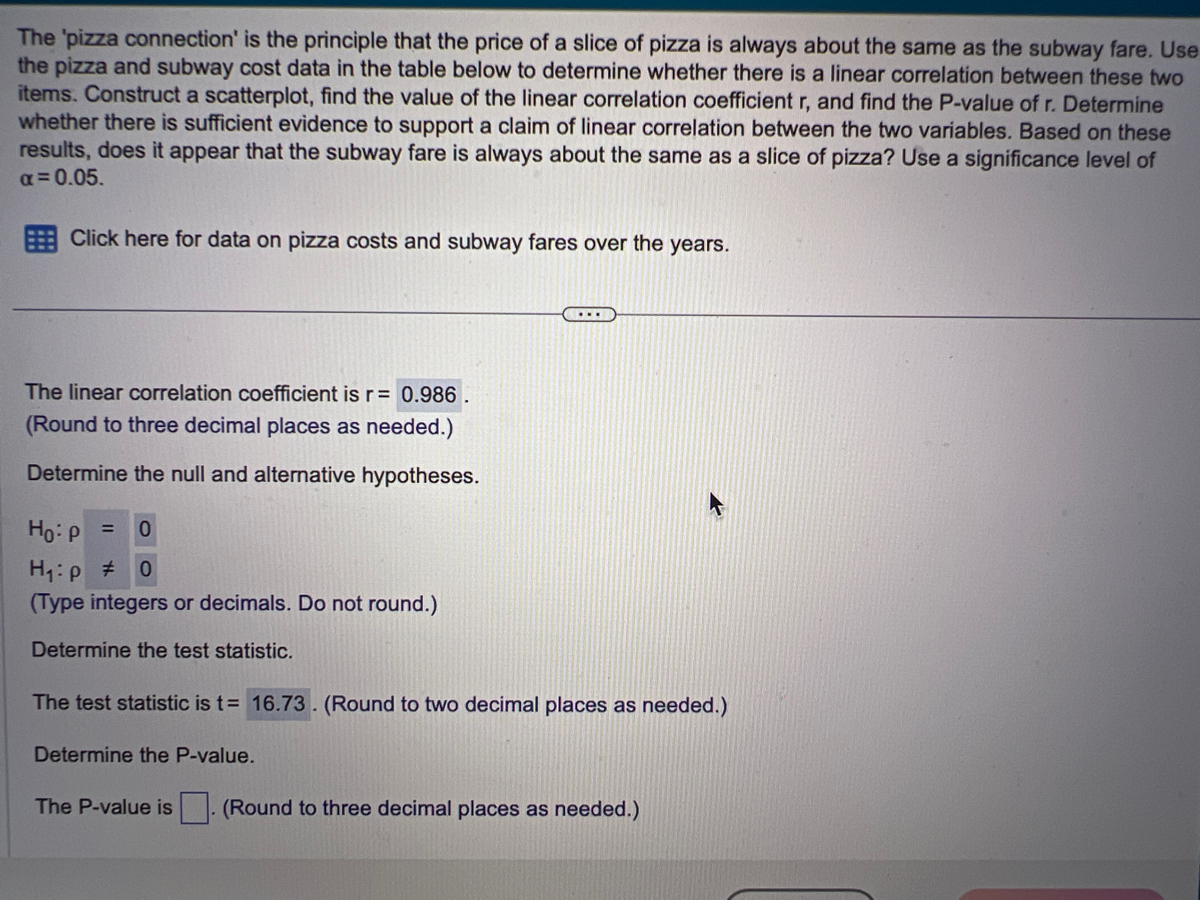

Transcribed Image Text:The 'pizza connection' is the principle that the price of a slice of pizza is always about the same as the subway fare. Use
the pizza and subway cost data in the table below to determine whether there is a linear correlation between these two
items. Construct a scatterplot, find the value of the linear correlation coefficient r, and find the P-value of r. Determine
whether there is sufficient evidence to support a claim of linear correlation between the two variables. Based on these
results, does it appear that the subway fare is always about the same as a slice of pizza? Use a significance level of
α = 0.05.
Click here for data on pizza costs and subway fares over the years.
The linear correlation coefficient is r= 0.986.
(Round to three decimal places as needed.)
Determine the null and alternative hypotheses.
...
Ho: p = 0
H₁:p #
0
(Type integers or decimals. Do not round.)
Determine the test statistic.
The test statistic is t= 16.73. (Round to two decimal places as needed.)
Determine the P-value.
The P-value is. (Round to three decimal places as needed.)

Transcribed Image Text:items. Construct a scatterplot, find the value of the linear correlation coefficie
r, and
whether there is sufficient evidence to support a claim of linear correlation between th
results does it annear that the subway fare is always about the same as a slice of piz
Pizza Cost and Subway Fares
Year
Pizza Cost
Subway Fare
CPI
1960 1973 1986 1995 2002 2003 2009 2013 2015
2019
1.25 1.75 2.00
3.00
0.15 0.35 1.00
0.20
2.25 2.30 2.75
2.25 2.45 2.80 2.70
0.30 1.05 1.40
29 44.4 109.6 152.2 180.0 184.0 214.5 233.0 237.0 252.2
2.00
1.45
Print
The P-value is
Done
The test statistic is t= 16.73. (Round to two decimal places as needed.)
Determine the P-value.
(Round to three decimal places as needed.)
Expert Solution
This question has been solved!
Explore an expertly crafted, step-by-step solution for a thorough understanding of key concepts.

This is a popular solution

Trending nowThis is a popular solution!

Step by stepSolved in 3 steps with 4 images

Knowledge Booster

Similar questions
arrow_back_ios
arrow_forward_ios
Recommended textbooks for you
- MATLAB: An Introduction with ApplicationsStatisticsISBN:9781119256830Author:Amos GilatPublisher:John Wiley & Sons Inc
 Probability and Statistics for Engineering and th...StatisticsISBN:9781305251809Author:Jay L. DevorePublisher:Cengage Learning
 Statistics for The Behavioral Sciences (MindTap C...StatisticsISBN:9781305504912Author:Frederick J Gravetter, Larry B. WallnauPublisher:Cengage Learning
  Elementary Statistics: Picturing the World (7th E...StatisticsISBN:9780134683416Author:Ron Larson, Betsy FarberPublisher:PEARSON
 The Basic Practice of StatisticsStatisticsISBN:9781319042578Author:David S. Moore, William I. Notz, Michael A. FlignerPublisher:W. H. Freeman
 Introduction to the Practice of StatisticsStatisticsISBN:9781319013387Author:David S. Moore, George P. McCabe, Bruce A. CraigPublisher:W. H. Freeman
MATLAB: An Introduction with Applications
Statistics
ISBN:9781119256830
Author:Amos Gilat
Publisher:John Wiley & Sons Inc
Probability and Statistics for Engineering and th...
Statistics
ISBN:9781305251809
Author:Jay L. Devore
Publisher:Cengage Learning
Statistics for The Behavioral Sciences (MindTap C...
Statistics
ISBN:9781305504912
Author:Frederick J Gravetter, Larry B. Wallnau
Publisher:Cengage Learning
Elementary Statistics: Picturing the World (7th E...
Statistics
ISBN:9780134683416
Author:Ron Larson, Betsy Farber
Publisher:PEARSON
The Basic Practice of Statistics
Statistics
ISBN:9781319042578
Author:David S. Moore, William I. Notz, Michael A. Fligner
Publisher:W. H. Freeman
Introduction to the Practice of Statistics
Statistics
ISBN:9781319013387
Author:David S. Moore, George P. McCabe, Bruce A. Craig
Publisher:W. H. Freeman