
MATLAB: An Introduction with Applications
6th Edition
ISBN: 9781119256830
Author: Amos Gilat
Publisher: John Wiley & Sons Inc
expand_more
expand_more
format_list_bulleted
Related questions
Topic Video
Question
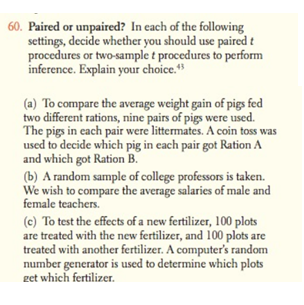

Transcribed Image Text:Paired or unpaired? In cach of the following
settings, decide whether you should use paired t
procedures or two-sample t procedures to perform
inference. Explain your choice."
(a) To compare the average weight gain of pigs fed
two different rations, nine pairs of pigs were used.
The pigs in each pair were littermates. A coin toss was
used to decide which pig in each pair got Ration A
and which got Ration B.
(b) A random sample of college professors is taken.
We wish to compare the average salaries of male and
female teachers.
(c) To test the effects of a new fertilizer, 100 plots
are treated with the new fertilizer, and 100 plots are
treated with another fertilizer. A computer's random
number generator is used to determine which plots
get which fertilizer.
Expert Solution
This question has been solved!
Explore an expertly crafted, step-by-step solution for a thorough understanding of key concepts.

This is a popular solution

Trending nowThis is a popular solution!

Step by stepSolved in 4 steps

Knowledge Booster


Learn more about
Need a deep-dive on the concept behind this application? Look no further. Learn more about this topic, statistics and related others by exploring similar questions and additional content below.Similar questions
- A public opinion poll surveyed a simple random sample of voters. Respondents were classified by gender (female or male) and by voting preference (Republican, Democrat, or Independent). The results are presented here: Republican 261 202 Female Male You want to determine if gender and voting preference are independent. Use a level of significance of a = 0.05. What is the test statistic for this test? (Round your answer to three decimal places.) Democrat 239 181 Independent 42 62arrow_forwardjust the last part, thank you!arrow_forwardA plumber was interested in determining whether there is a significant difference in the price charged for plumbing tools by two hardware stores. The plumber selected five tools and recorded the price for each tool in each store. The following data was recorded: Store 1 2 Tool 2 R59.25 R22.50 R450 R44.25 R22.50 R36.75 R75 4 R480 R44.25 R60 Perform the appropriate test of hypothesis to determine whether there is a significant difference, on average, in the price of plumbing tools between the two stores, showing all 7 steps. Include both the rejection region and the p-value.arrow_forward
- A crossover trial is a type of experiment used to compare two drugs. Subjects take one drug for a period of time, then switch to the other. The responses of the subjects are then compared using matched-pair methods. In an experiment to compare two pain relievers, seven subjects took one pain reliever for two weeks, then switched to the other. They rated their pain level from 1 to 10, with larger numbers representing higher levels of pain. The results were: Subject Drug A Drug B 1 6 5 2 3 1 3 4 4 7 6 2 7 4 2 Can you conclude that the mean pain level is less with drug B? Use a=0.05. (1) Critical Value (Round off to 3 decimal places): (2) Test Statistic (Round off to 2 decimal places): (3) Conclusion: (Type 'Reject HO' or 'Fail to Reject HO')arrow_forwardDataset: NES. Variables: spend8, nesw.) The NES dataset contains spend8, which records the number of government policy areas where respondents think spending should be increased. Scores range from 0 (the respondent does not want to increase spending on any of the policies) to 8 (the respondent wants to increase spending on all eight policies). The NES, of course, polls a random sample of U.S. adults. In this exercise you will analyze spend8 using the Analyze ▶ Compare Means ▶ One-Sample T Test procedure. You then will draw inferences about the population mean. Make sure you weight observations using the nesw variable so your results are nationally representative. A. The spend8 variable has a sample mean of ______.arrow_forwardA research study wanted to examine whether religious belief and gender are related in their state. They selected a representative sample of men and women in their State.Select the null and alternative hypothesis of the test: H0: there is no relationship between gender and belief about human originsHa: there is a relationship between gender and belief about human origins H0: there is a relationship between gender and belief about human originsHa: there is no relationship between gender and belief about human origins Results of the study are summarized in this table for the Belief about human origins: religious texts evolutionary theory total male 30 36 66 female 110 89 199 total 140 125 265 The degrees of freedom for the the ?2 statistic are Round the following numbers to two places after the decimal:The test statistic is ?2 = with a p-value = The conclusion of the test at the 5% significance level is There is not enough statistical evidence to suggest that gender…arrow_forward
- please send answerarrow_forward"A manufacturer of shampoo claims that 72% of the shampoo users prefer brand X. To test this claim, a random sample of 44 participants are selected and asked what brand they prefer. If 31 of the 44 participants prefer brand X, what conclusion do we draw? Use a 0.1 level of significance. What are the given? hypothesized proportion:Blank 1% sample proportion:Blank 2 (Write your answer in fraction form form and simplify your answer) sample size:Blank 3 level of significance:Blank 4 What are the critical values? Write the positve first then the negative z:Blank 5 andBlank 6 What is the calculated z? Round your answer to the nearest hundredths. z:Blank 7"arrow_forward
arrow_back_ios
arrow_forward_ios
Recommended textbooks for you
- MATLAB: An Introduction with ApplicationsStatisticsISBN:9781119256830Author:Amos GilatPublisher:John Wiley & Sons Inc
 Probability and Statistics for Engineering and th...StatisticsISBN:9781305251809Author:Jay L. DevorePublisher:Cengage Learning
 Statistics for The Behavioral Sciences (MindTap C...StatisticsISBN:9781305504912Author:Frederick J Gravetter, Larry B. WallnauPublisher:Cengage Learning
  Elementary Statistics: Picturing the World (7th E...StatisticsISBN:9780134683416Author:Ron Larson, Betsy FarberPublisher:PEARSON
 The Basic Practice of StatisticsStatisticsISBN:9781319042578Author:David S. Moore, William I. Notz, Michael A. FlignerPublisher:W. H. Freeman
 Introduction to the Practice of StatisticsStatisticsISBN:9781319013387Author:David S. Moore, George P. McCabe, Bruce A. CraigPublisher:W. H. Freeman
MATLAB: An Introduction with Applications
Statistics
ISBN:9781119256830
Author:Amos Gilat
Publisher:John Wiley & Sons Inc
Probability and Statistics for Engineering and th...
Statistics
ISBN:9781305251809
Author:Jay L. Devore
Publisher:Cengage Learning
Statistics for The Behavioral Sciences (MindTap C...
Statistics
ISBN:9781305504912
Author:Frederick J Gravetter, Larry B. Wallnau
Publisher:Cengage Learning
Elementary Statistics: Picturing the World (7th E...
Statistics
ISBN:9780134683416
Author:Ron Larson, Betsy Farber
Publisher:PEARSON
The Basic Practice of Statistics
Statistics
ISBN:9781319042578
Author:David S. Moore, William I. Notz, Michael A. Fligner
Publisher:W. H. Freeman
Introduction to the Practice of Statistics
Statistics
ISBN:9781319013387
Author:David S. Moore, George P. McCabe, Bruce A. Craig
Publisher:W. H. Freeman