ENGR.ECONOMIC ANALYSIS
14th Edition
ISBN: 9780190931919
Author: NEWNAN
Publisher: Oxford University Press
expand_more
expand_more
format_list_bulleted
Question

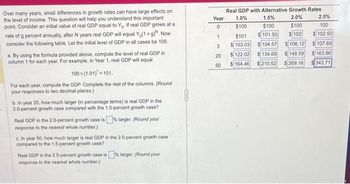
Transcribed Image Text:Over many years, small differences in growth rates can have large effects on
the level of income. This question will help you understand this important
point. Consider an initial value of real GDP equal to Yo. If real GDP grows at a
rate of g percent annually, after N years real GDP will equal Yo(1+g). Now
consider the following table. Let the initial level of GDP in all cases be 100.
a. By using the formula provided above, compute the level of real GDP in
column 1 for each year. For example, in Year 1, real GDP will equal
100x (1.01)¹=101.
For each year, compute the GDP. Complete the rest of the columns. (Round
your responses to two decimal places.)
b. In year 20, how much larger (in percentage terms) is real GDP in the
2.0-percent growth case compared with the 1.5-percent growth case?
Real GDP in the 2.0-percent growth case is% larger. (Round your
response to the nearest whole number.)
c. In year 50, how much larger is real GDP in the 2.0-percent growth case
compared to the 1.5-percent growth case?
Real GDP in the 2.0-percent growth case is % larger. (Round your
response to the nearest whole number.)
Year
0
1
3
20
50
Real GDP with Alternative Growth Rates.
2.0%
$100
$102
1.0%
$100
$101
$103.03.
122.02
$164.46
1.5%
2.5%
$100
100
101.50
$102.50
104.57
106.12
107.69
134.69
$ 148.59
163.86
$210.52 $269.16 343.71
Expert Solution
This question has been solved!
Explore an expertly crafted, step-by-step solution for a thorough understanding of key concepts.
Step by stepSolved in 5 steps

Knowledge Booster
Learn more about
Need a deep-dive on the concept behind this application? Look no further. Learn more about this topic, economics and related others by exploring similar questions and additional content below.Similar questions
- 1. The following table shows Spain's (awalizr) quarterly real GDP growth rates for the 2007–2012 period. (Roman numbers refer to quarters.) Variable 2007 2007 2007 2007 2008 2008 I II III IV I II Real GDP 7.6 7.3 6.5 6.4 5.6 4.6 Variable 2008 2008 2009 2009 2009 2009 III IV I II III IV Real GDP 3.1 0.5 -0.1 -4.1 -4.5 -3.3 Variable 2010 2010 2010 2010 2011 2011 I II III IV I II Real GDP -1.5 -0.2 0.0 0.4 0.5 0.5 Variable 2011 2011 2012 2012 2012 2012 III IV II III IV Real GDP 0.6 0.0 -0.7 -1.4 -1.6 -1.9 а) Plot real GDP growth rate in a graph, and identify a trend in the data. b) Based on the data shown, identify the beginning (i.e., the year and the quarter) of the current recession. 2. Unemployment is a very important topic in macroeconomics. A high unemployment rate means that a lot of individuals willing to work cannot find a job. This is bad for the economy, as some resources (i.e., labour) remain idle. Comment on the effects that being unemployed have on an individual.arrow_forwardSuppose the u.s. nominal GDP increases from one year to the next year. Can you conclude that these figures present a misleading measure of economic growth?arrow_forward12. Suppose an economy represented by the graph below started with K = 25, so it was in a steady state, but then disaster struck and most of the capital was destroyed. (Assume that no people were hurt so the labor force is the same size.) dK 25 K After the disaster would we expect the economy to grow or shrink? a. grow, I> dK b. grow, I dK d. shrink, I< dKarrow_forward
- The real GDP in 2010 was $1,800 billion and $1,944 billion in 2011.What is the growth rate in real GDP measured in percentage change? Question 9Answer a. 6% b. 7% c. 5% d. 8%arrow_forwardGive the latest estimated values of GDP, of GDP per capita, and of GNI, in the U.S., as reported by the US Department of Commerce, in both real and nominal values. Provide the most recent estimates of the rates of growth of GDP, in both real and nominal terms.arrow_forward
arrow_back_ios
arrow_forward_ios
Recommended textbooks for you

 Principles of Economics (12th Edition)EconomicsISBN:9780134078779Author:Karl E. Case, Ray C. Fair, Sharon E. OsterPublisher:PEARSON
 Engineering Economy (17th Edition)EconomicsISBN:9780134870069Author:William G. Sullivan, Elin M. Wicks, C. Patrick KoellingPublisher:PEARSON
 Principles of Economics (MindTap Course List)EconomicsISBN:9781305585126Author:N. Gregory MankiwPublisher:Cengage Learning
 Managerial Economics: A Problem Solving ApproachEconomicsISBN:9781337106665Author:Luke M. Froeb, Brian T. McCann, Michael R. Ward, Mike ShorPublisher:Cengage Learning
 Managerial Economics & Business Strategy (Mcgraw-...EconomicsISBN:9781259290619Author:Michael Baye, Jeff PrincePublisher:McGraw-Hill Education


Principles of Economics (12th Edition)
Economics
ISBN:9780134078779
Author:Karl E. Case, Ray C. Fair, Sharon E. Oster
Publisher:PEARSON

Engineering Economy (17th Edition)
Economics
ISBN:9780134870069
Author:William G. Sullivan, Elin M. Wicks, C. Patrick Koelling
Publisher:PEARSON

Principles of Economics (MindTap Course List)
Economics
ISBN:9781305585126
Author:N. Gregory Mankiw
Publisher:Cengage Learning

Managerial Economics: A Problem Solving Approach
Economics
ISBN:9781337106665
Author:Luke M. Froeb, Brian T. McCann, Michael R. Ward, Mike Shor
Publisher:Cengage Learning

Managerial Economics & Business Strategy (Mcgraw-...
Economics
ISBN:9781259290619
Author:Michael Baye, Jeff Prince
Publisher:McGraw-Hill Education