MATLAB: An Introduction with Applications
6th Edition
ISBN: 9781119256830
Author: Amos Gilat
Publisher: John Wiley & Sons Inc
expand_more
expand_more
format_list_bulleted
Question

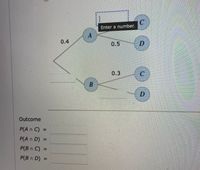
Transcribed Image Text:C.
Enter a number.
0.4
0.5
0.3
Outcome
P(A n C) =
%3D
P(A n D) =
%3D
P(B n C) =
%3D
P(B n D) =
%3D
B.
Expert Solution
This question has been solved!
Explore an expertly crafted, step-by-step solution for a thorough understanding of key concepts.
Step by stepSolved in 3 steps with 3 images

Knowledge Booster
Similar questions
- Data Set: {(−3,4), (−2, 3), (−1, 3), (0, 7), (1, 5), (2, 6), (3, 1)} 1. The regression line is: y = -2 FS 0.3 Your Turn: Data Set 2 2. Based on the regression line, we would expect the value of response variable to be 0.005 4. If x= -3.5, the y = 1 when the explanatory variable is 0. 3. For each increase of 1 in of the explanatory variable, we can expect a(n) decrease of 1 in the response variable. ovemple of F6 evtrannlation X O Search MALERINION 8 *. This is an g prt sc homearrow_forwardHow do I do this: "Find the value of the coefficient of determination r2. What percentage of the variation in y can be explained by the corresponding variation in x and the least-squares line? What percentage is unexplained? (Round your answer for r2 to three decimal places. Round your answers for the percentages to one decimal place.)"arrow_forwardI’m taking a statistics and probability class. Please get this correct because I want to learn. I have gotten wrong answers on here beforearrow_forward
- When a sample survey asks people about use of illegal drugs, some people who use drugs will lie and say they do not use drugs because they fear that the information will be given to the police or employers. O This is a nonsampling error that causes bias. O This is a sampling error that increases variability. O This is a nonsampling error that increases variability. O This is a sampling error that causes bias.arrow_forwardIf Cov(X,Y)=-99, o? = 121 and o = 81 then, coefficient of correlation r(X, Y) will be %3D Select one: O +1.000 O - 1.000 O +0.0101 0.0101 PREVIOUS PAGE re to search 立arrow_forwardusing Excelarrow_forward
- A researcher conducts a multiple regression with Y as the dependent variable and X1, X2, X3 and X4 as explanatory variables. Using the regression output below, fully describe this model and discuss important parts of the output. What is the predicted value of Y if X1 = 3, X2 = 15, X3 = 7 and X4 = 0.003? %3D SUMMARY OUTPUT Regression Staistics Muliple R R Square Adjusted R Square Standard Emor Observations 0.7236 0.5236 0.5159 5.3928 252 ANOVA Significance F 1. 10662E-38 SS MS Regression Residual 1973 9392 29.0820 67.8749 7895.7567 7183.2599 4 247 Total 251 15079.0166 Upper 95% 33.4049 Coefficients Standard Eror t Stat Pvalue 2.2273 0.026830873 Lower 95% 7.9594 2.0508 Intercept X1 17.7278 1.5583 0.2750 5.6662 4.05265E-08 1.0166 2.0999 X2 1.8376 0.1997 9.1999 1.4442 -74708 -3721 4324 1.55861E-17 2.2310 X3 55100 -5.5348 7.94036E-08 -3.5492 X4 -3.1079 1887 8435 -0.0016 0.998687788 3715 2166arrow_forwardThe next four questions (29 to 32) refer to the following: To most Canadians, earthquakes are viewed as rare occurrences, but they are actually quite common. In just one month in 2001, Natural Resources Canada recorded 215 earthquakes that affected Canada from B.C. to Nunavut to Newfoundland. We would like to determine whether there is a linear relationship between the location of an earth- quake X (measured in degrees latitude north of the equator) and the magnitude of the earthquake Y (measured on the Richter scale). The explanatory and response variables are measured for a sample of 13 earthquakes. The equation of the least squares regression line is ŷ = -3.05+ 0.10x. The ANOVA table is showm below: ге Source of Variation df Sum of Squares Mean Square F Regression Error Total 1.40 25.10arrow_forwardIn bivariate regression, the value of Y when X equals 0 is: Group of answer choices Intercept (b0) Residual Slope (b1)arrow_forward
arrow_back_ios
arrow_forward_ios
Recommended textbooks for you
 MATLAB: An Introduction with ApplicationsStatisticsISBN:9781119256830Author:Amos GilatPublisher:John Wiley & Sons Inc
 Probability and Statistics for Engineering and th...StatisticsISBN:9781305251809Author:Jay L. DevorePublisher:Cengage Learning
 Statistics for The Behavioral Sciences (MindTap C...StatisticsISBN:9781305504912Author:Frederick J Gravetter, Larry B. WallnauPublisher:Cengage Learning
 Elementary Statistics: Picturing the World (7th E...StatisticsISBN:9780134683416Author:Ron Larson, Betsy FarberPublisher:PEARSON
 The Basic Practice of StatisticsStatisticsISBN:9781319042578Author:David S. Moore, William I. Notz, Michael A. FlignerPublisher:W. H. Freeman
 Introduction to the Practice of StatisticsStatisticsISBN:9781319013387Author:David S. Moore, George P. McCabe, Bruce A. CraigPublisher:W. H. Freeman

MATLAB: An Introduction with Applications
Statistics
ISBN:9781119256830
Author:Amos Gilat
Publisher:John Wiley & Sons Inc

Probability and Statistics for Engineering and th...
Statistics
ISBN:9781305251809
Author:Jay L. Devore
Publisher:Cengage Learning

Statistics for The Behavioral Sciences (MindTap C...
Statistics
ISBN:9781305504912
Author:Frederick J Gravetter, Larry B. Wallnau
Publisher:Cengage Learning

Elementary Statistics: Picturing the World (7th E...
Statistics
ISBN:9780134683416
Author:Ron Larson, Betsy Farber
Publisher:PEARSON

The Basic Practice of Statistics
Statistics
ISBN:9781319042578
Author:David S. Moore, William I. Notz, Michael A. Fligner
Publisher:W. H. Freeman

Introduction to the Practice of Statistics
Statistics
ISBN:9781319013387
Author:David S. Moore, George P. McCabe, Bruce A. Craig
Publisher:W. H. Freeman