
MATLAB: An Introduction with Applications
6th Edition
ISBN: 9781119256830
Author: Amos Gilat
Publisher: John Wiley & Sons Inc
expand_more
expand_more
format_list_bulleted
Related questions
Topic Video
Question
using Excel
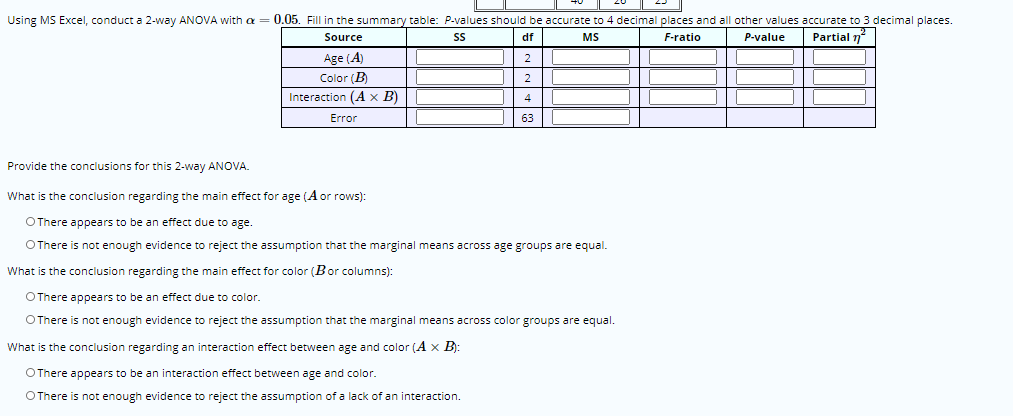

Transcribed Image Text:Using MS Excel, conduct a 2-way ANOVA with a= 0.05. Fill in the summary table: P-values should be accurate to 4 decimal places and all other values accurate to 3 decimal places.
Source
df
MS
F-ratio
P-value
Partial n
Age (A)
Color (B)
2
Interaction (Ax B)
4
Error
63
Provide the conclusions for this 2-way ANOVA.
What is the conclusion regarding the main effect for age (A or rows):
OThere appears to be an effect due to age.
O There is not enough evidence to reject the assumption that the marginal means across age groups are equal.
What is the conclusion regarding the main effect for color (Bor columns):
OThere appears to be an effect due to color.
OThere is not enough evidence to reject the assumption that the marginal means across color groups are equal.
What is the conclusion regarding an interaction effect between age and color (A x B):
OThere appears to be an interaction effect between age and color.
OThere is not enough evidence to reject the assumption of a lack of an interaction.

Transcribed Image Text:An educational psychologist is examining response times to an on-screen stimulus. The researcher believes there might be a weak effect from age, but expects a more pronounced effect for different color contrasts.
She decides to examine a black on white (B/W) combination compared to 2 alternatives: red on white (R/W) and yellow on blue (Y/B). Here is the data for response times (in milliseconds):
Color Scheme
B/W
R/W
Y/B
36
19
24
26
31
33
16
7
19
20
7
16-17
20
3
43
20
10
23
43
19
Age 18-19
34
15
17
35
13
36
35
28
35
40
20-21
25
Expert Solution
This question has been solved!
Explore an expertly crafted, step-by-step solution for a thorough understanding of key concepts.

Step by stepSolved in 2 steps with 3 images

Knowledge Booster


Learn more about
Need a deep-dive on the concept behind this application? Look no further. Learn more about this topic, statistics and related others by exploring similar questions and additional content below.Similar questions
arrow_back_ios
arrow_forward_ios
Recommended textbooks for you
- MATLAB: An Introduction with ApplicationsStatisticsISBN:9781119256830Author:Amos GilatPublisher:John Wiley & Sons Inc
 Probability and Statistics for Engineering and th...StatisticsISBN:9781305251809Author:Jay L. DevorePublisher:Cengage Learning
 Statistics for The Behavioral Sciences (MindTap C...StatisticsISBN:9781305504912Author:Frederick J Gravetter, Larry B. WallnauPublisher:Cengage Learning
  Elementary Statistics: Picturing the World (7th E...StatisticsISBN:9780134683416Author:Ron Larson, Betsy FarberPublisher:PEARSON
 The Basic Practice of StatisticsStatisticsISBN:9781319042578Author:David S. Moore, William I. Notz, Michael A. FlignerPublisher:W. H. Freeman
 Introduction to the Practice of StatisticsStatisticsISBN:9781319013387Author:David S. Moore, George P. McCabe, Bruce A. CraigPublisher:W. H. Freeman
MATLAB: An Introduction with Applications
Statistics
ISBN:9781119256830
Author:Amos Gilat
Publisher:John Wiley & Sons Inc
Probability and Statistics for Engineering and th...
Statistics
ISBN:9781305251809
Author:Jay L. Devore
Publisher:Cengage Learning
Statistics for The Behavioral Sciences (MindTap C...
Statistics
ISBN:9781305504912
Author:Frederick J Gravetter, Larry B. Wallnau
Publisher:Cengage Learning
Elementary Statistics: Picturing the World (7th E...
Statistics
ISBN:9780134683416
Author:Ron Larson, Betsy Farber
Publisher:PEARSON
The Basic Practice of Statistics
Statistics
ISBN:9781319042578
Author:David S. Moore, William I. Notz, Michael A. Fligner
Publisher:W. H. Freeman
Introduction to the Practice of Statistics
Statistics
ISBN:9781319013387
Author:David S. Moore, George P. McCabe, Bruce A. Craig
Publisher:W. H. Freeman