MATLAB: An Introduction with Applications
6th Edition
ISBN: 9781119256830
Author: Amos Gilat
Publisher: John Wiley & Sons Inc
expand_more
expand_more
format_list_bulleted
Question

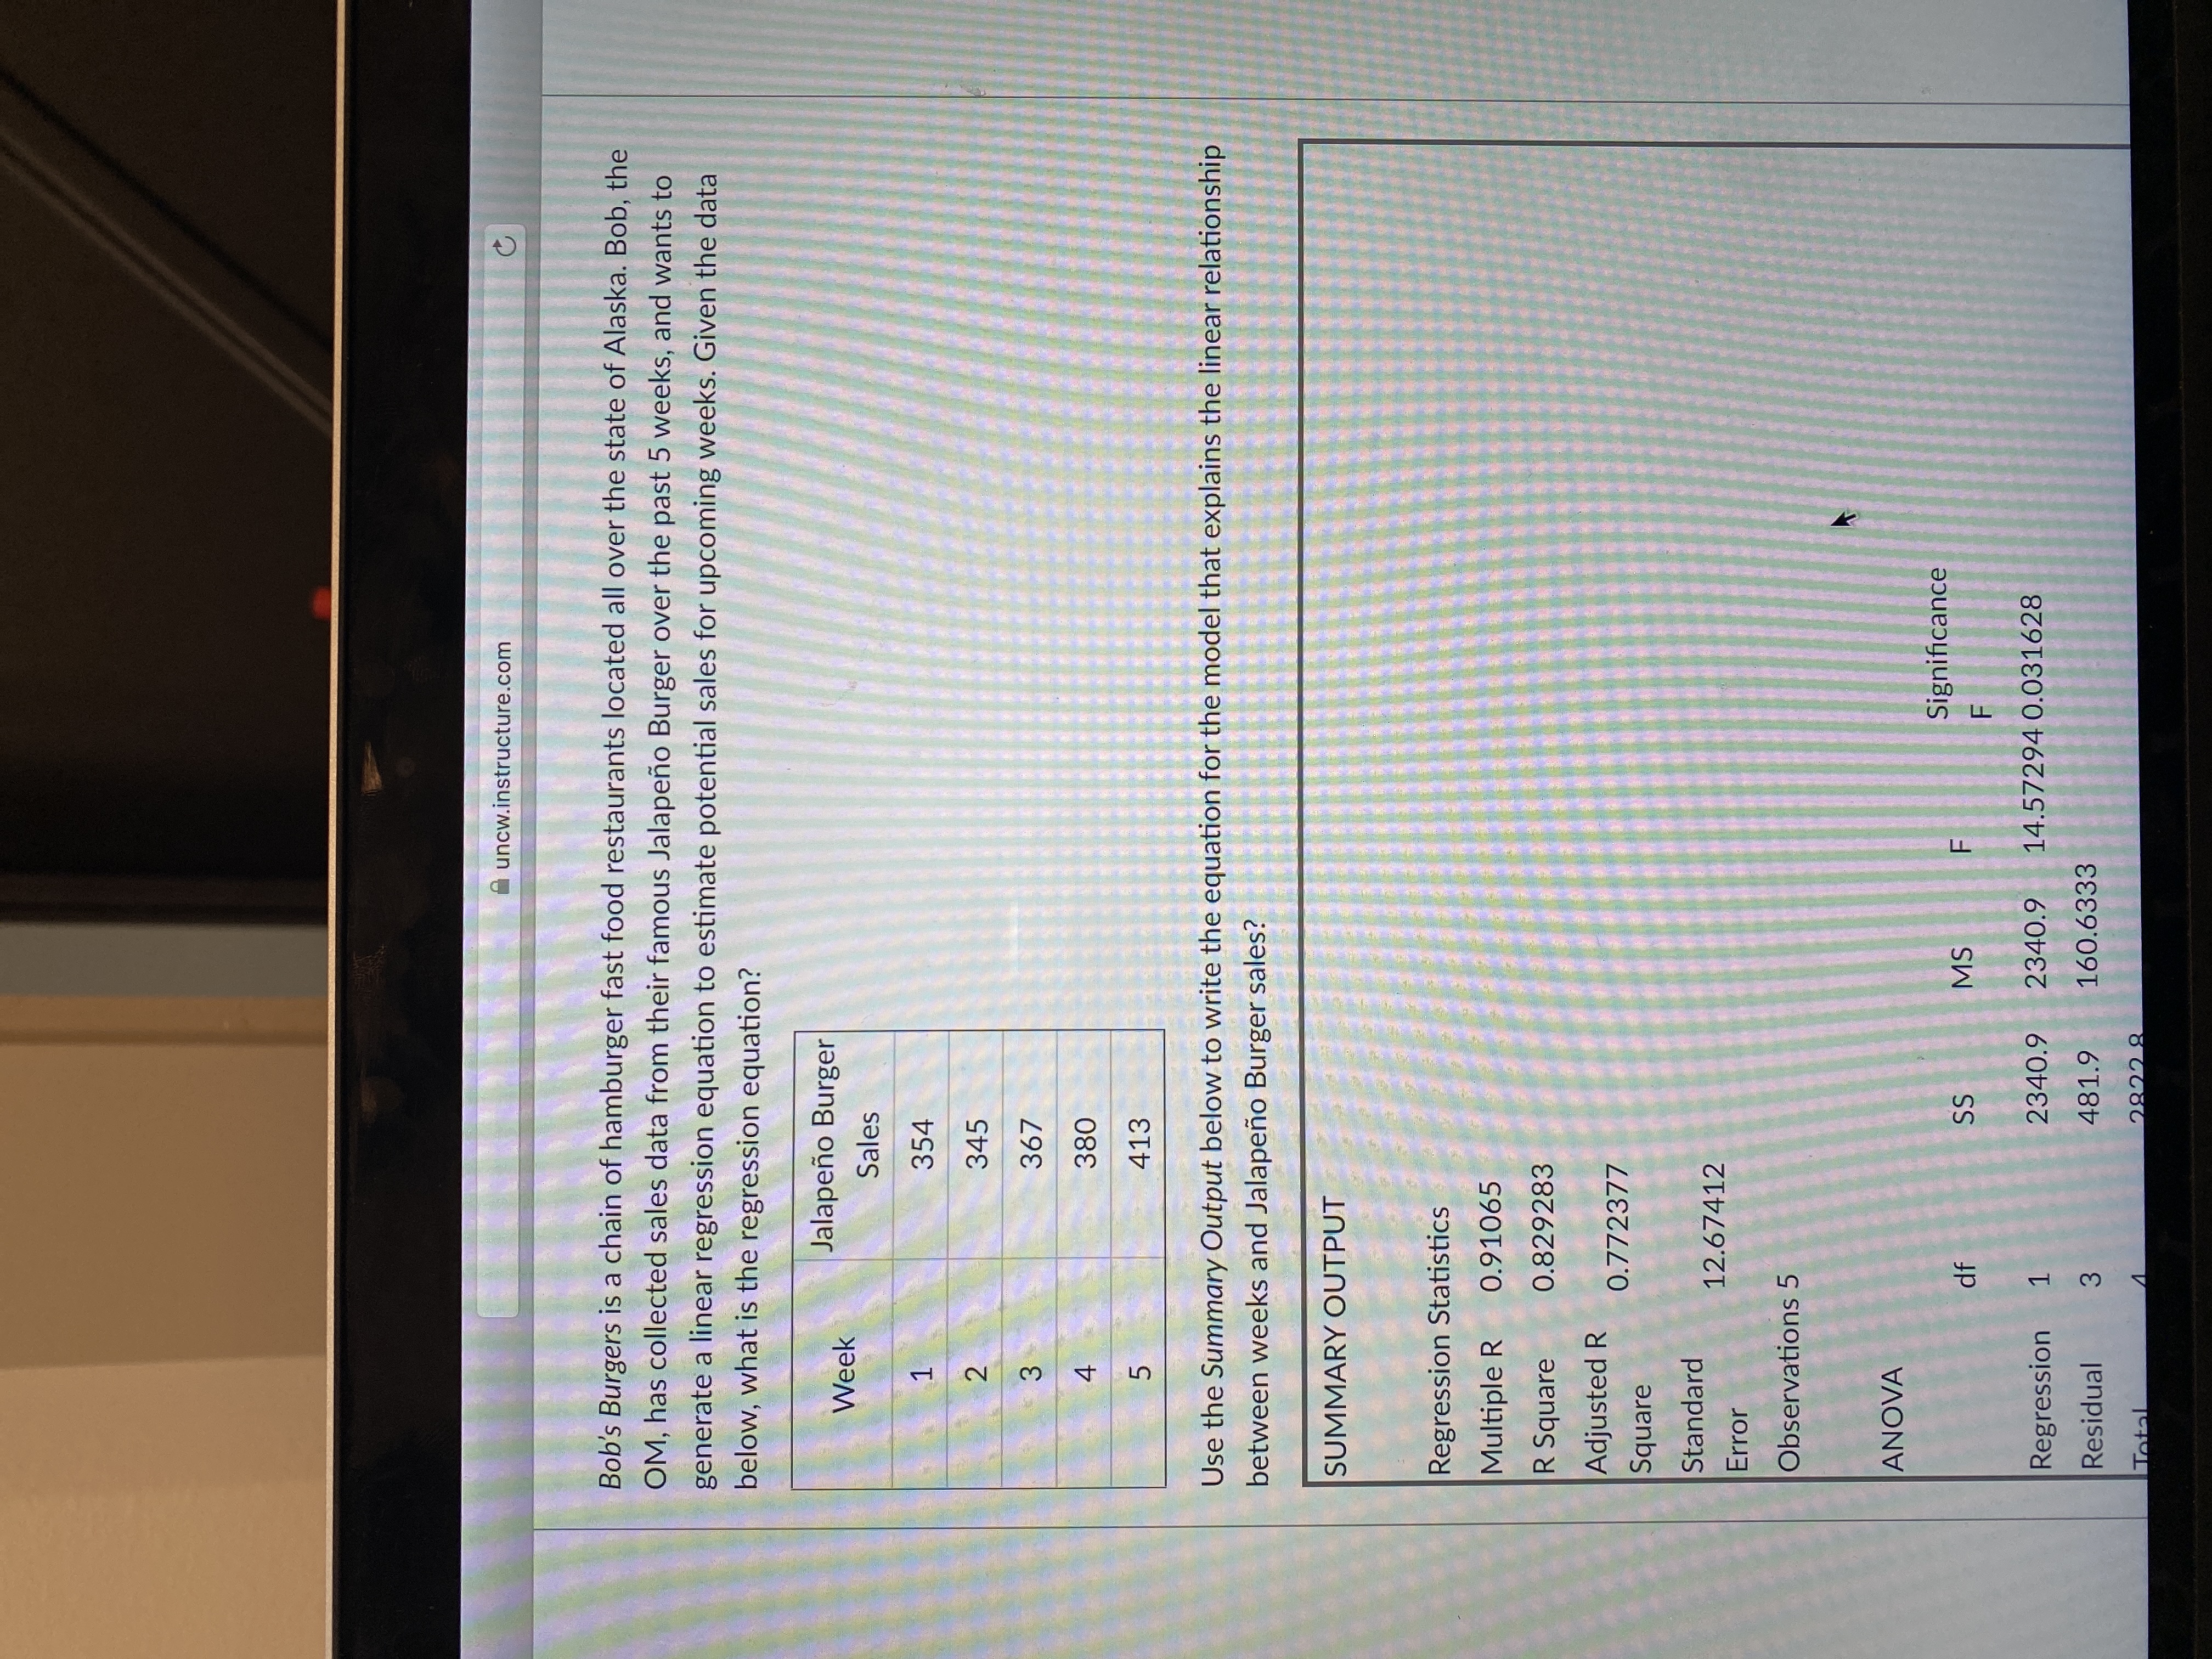
Transcribed Image Text:of
A uncw.instructure.com
Bob's Burgers is a chain of hamburger fast food restaurants located all over the state of Alaska. Bob, the
OM, has collected sales data from their famous Jalapeño Burger over the past 5 weeks, and wants to
generate a linear regression equation to estimate potential sales for upcoming weeks. Given the data
below, what is the regression equation?
Jalapeño Burger
Week
Sales
354
345
367
3.
380
4.
413
5.
Use the Summary Output below to write the equation for the model that explains the linear relationship
between weeks and Jalapeño Burger sales?
SUMMARY OUTPUT
Regression Statistics
Multiple R
0.91065
R Square
0.829283
Adjusted R
0.772377
Square
Standard
12.67412
Error
Observations 5
ANOVA
Significance
SS
MS
F.
Regression
1.
2340.9
2340.9
14.57294 0.031628
Residual
481.9
160.6333
3.

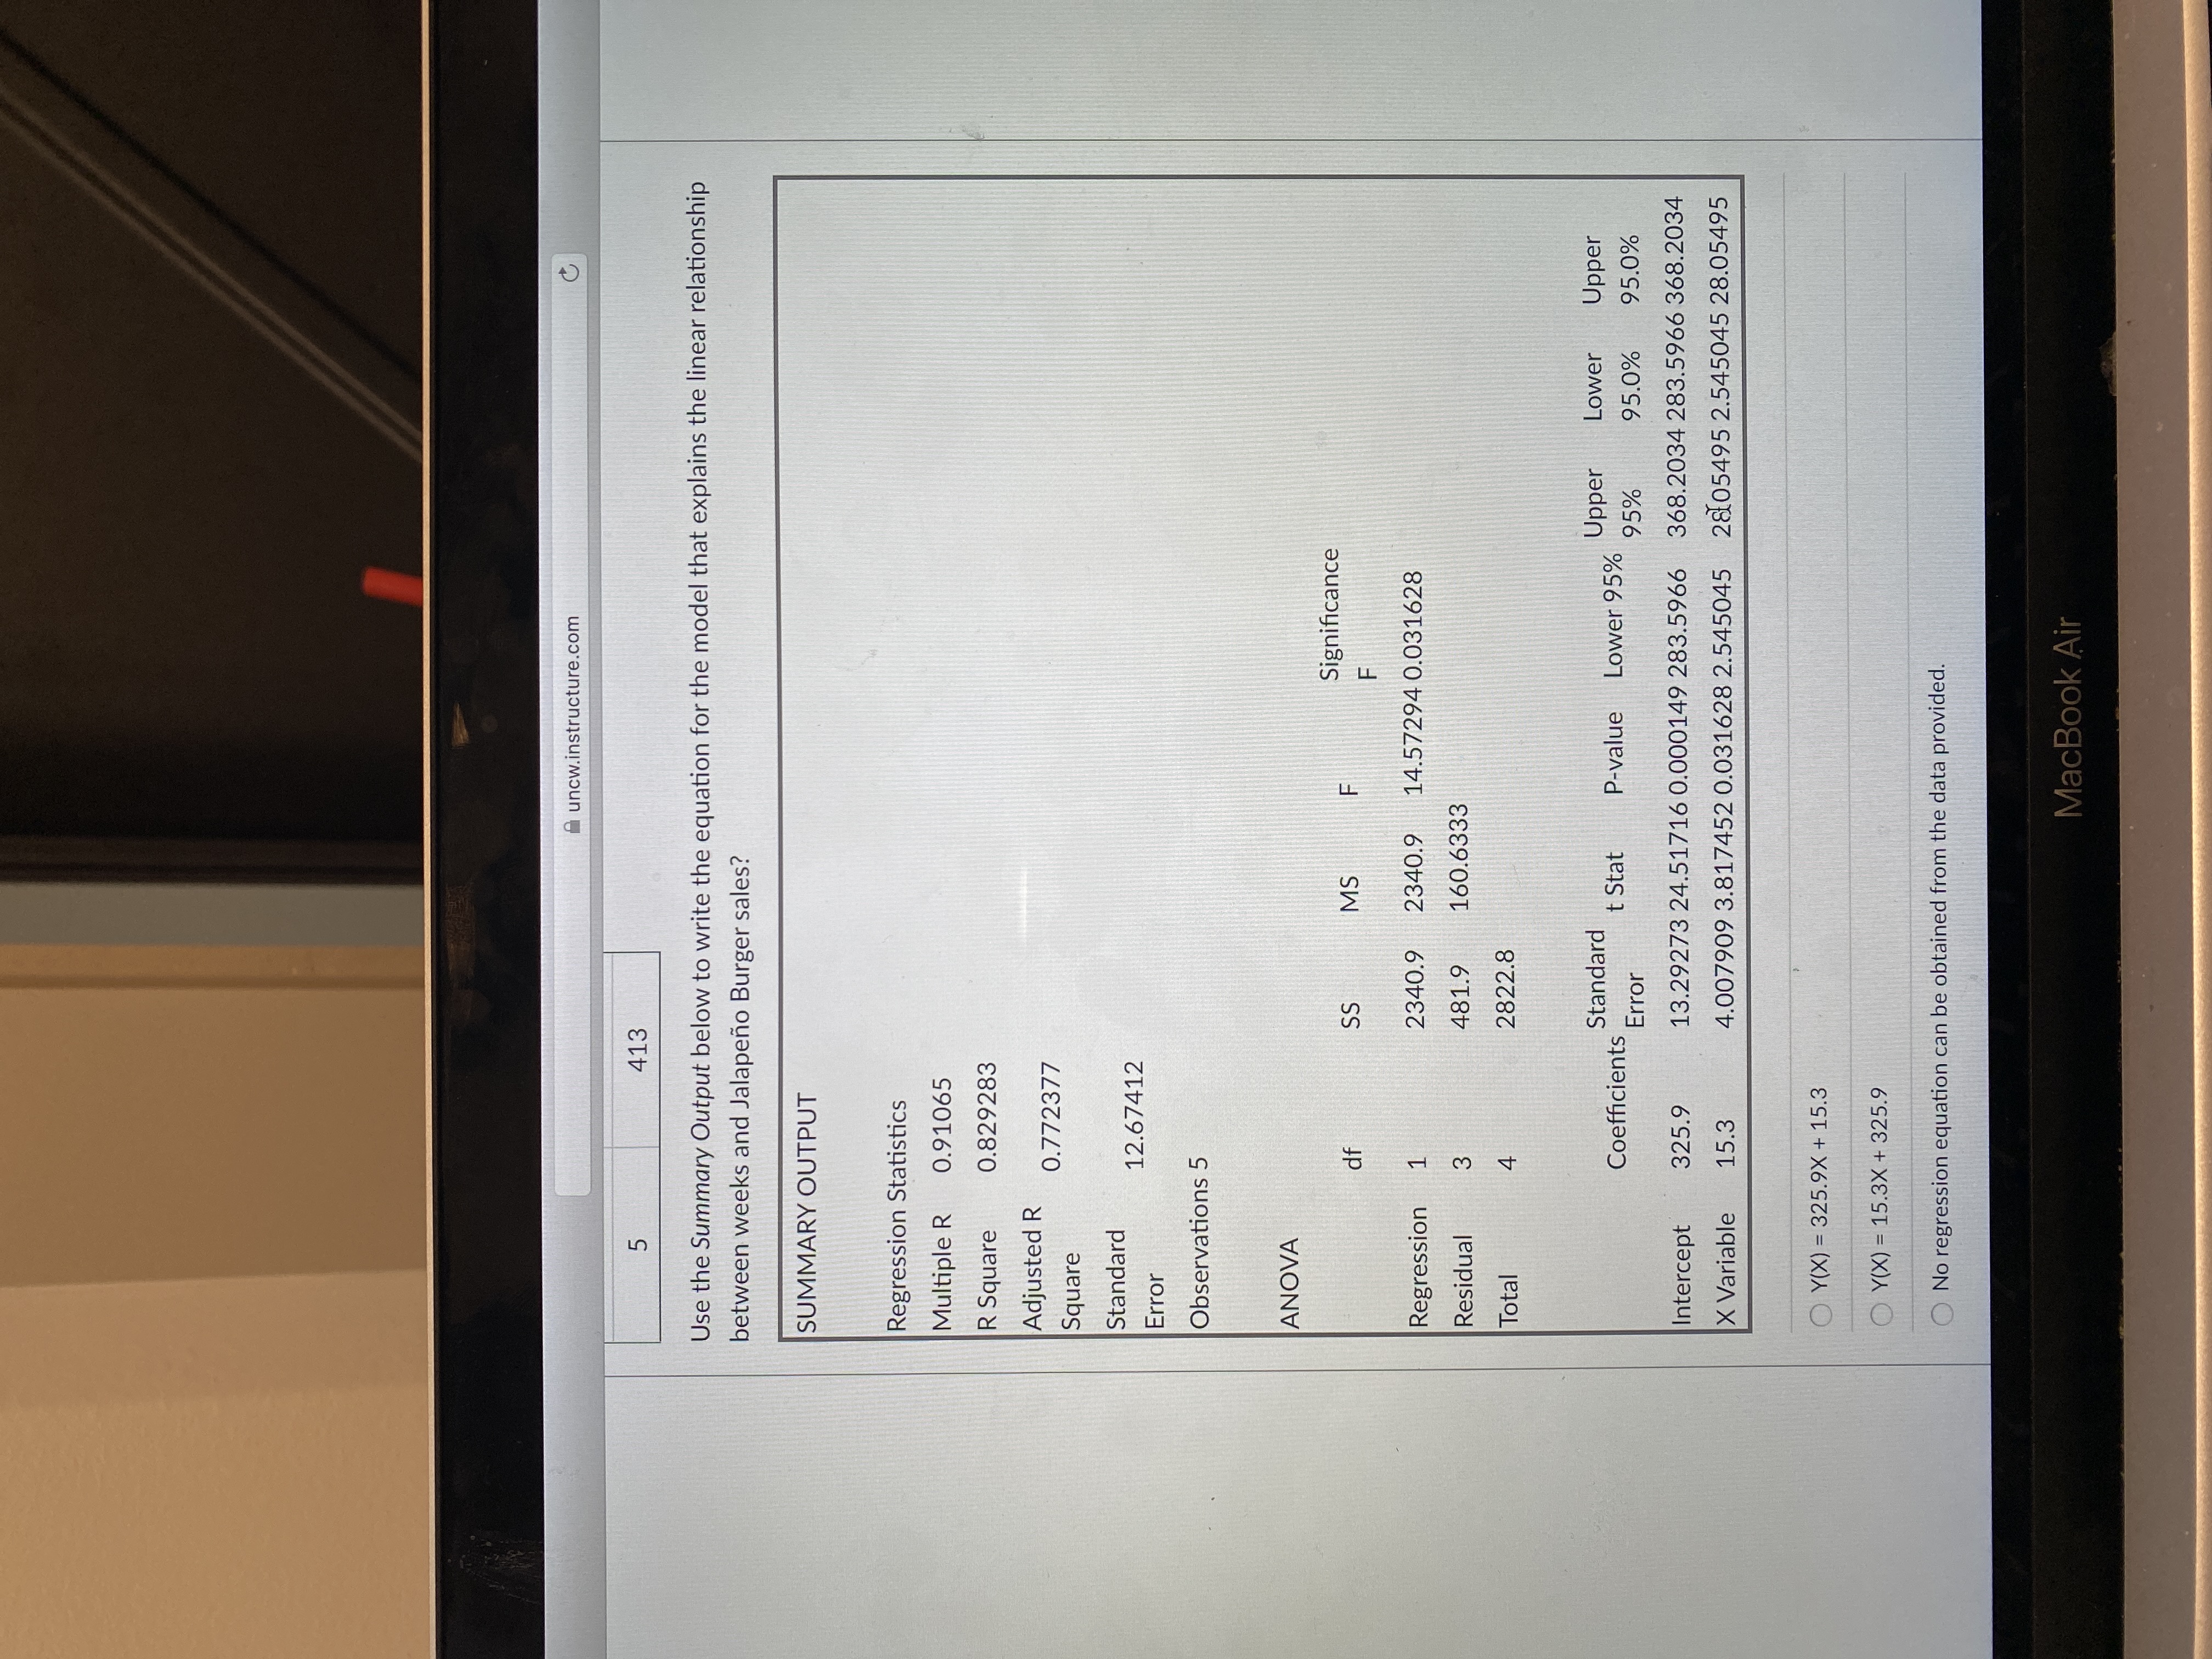
Transcribed Image Text:uncw.instructure.com
413
5.
Use the Summary Output below to write the equation for the model that explains the linear relationship
between weeks and Jalapeño Burger sales?
SUMMARY OUTPUT
Regression Statistics
Multiple R
0.91065
R Square
0.829283
Adjusted R
Square
0.772377
Standard
12.67412
Error
Observations 5
ANOVA
Significance
df
SS
MS
Regression
2340.9
6'0
14.57294 0.031628
1.
Residual
481.9
160.6333
3.
Total
2822.8
4.
Standard
Upper
Lower
Upper
Coefficients
t Stat
P-value
Lower 95%
Error
95%
Intercept
325.9
13.29273 24.51716 0.000149 283.5966 368.2034 283.5966 368.2034
X Variable
15.3
4.007909 3.817452 0.031628 2.545045 2805495 2.545045 28.05495
O Y(X) = 325.9X + 15.3
O Y(X) = 15.3X + 325.9
%3D
No regression equation can be obtained from the data provided.
MacBook Air
Expert Solution
This question has been solved!
Explore an expertly crafted, step-by-step solution for a thorough understanding of key concepts.
This is a popular solution
Trending nowThis is a popular solution!
Step by stepSolved in 3 steps

Knowledge Booster
Similar questions
- Using your favorite statistics software package, you generate a scatter plot with a regression equation and correlation coefficient. The regression equation is reported asy=−71.07x+16.92y=-71.07x+16.92and the r=−0.52r=-0.52.What percentage of the variation in y can be explained by the variation in the values of x?r² = % (Report exact answer, and do not enter the % sign)arrow_forwardThe table below gives the age and bone density for 5 women. Use the equation of the regression line, y= b0 + b1x, for predicting a women's bone density based on her age. The correlation coefficient may or may not be statically significant for the data given. Remember it wouldn't be appropiate to use regression line to make a prediction if the correlation coefficient isn;t statically significant. (y has a "hat" on the top) age 39 51 54 56 67 bone density 355 349 347 315 313 Find the estimated slope. Rund your answer to three decimal places. Find the estimated y-intercept. Round your answer to three decimal places. Determine the value of the dependent variable y at x+ 0 (y has a "hat" onthe top) Find the estimated value of y when x = 51. Round your answer to three decimal places. Substitute the values you found in steps 1 and 2 into the equation for the regression line to find the estimated linear model. According to this model, if the valueof the…arrow_forwardThe table below gives the number of hours spent unsupervised each day as well as the overall grade averages for five randomly selected middle school students. Using this data, consider the equation of the regression line, yˆ=b0+b1x, for predicting the overall grade average for a middle school student based on the number of hours spent unsupervised each day. Keep in mind, the correlation coefficient may or may not be statistically significant for the data given. Remember, in practice, it would not be appropriate to use the regression line to make a prediction if the correlation coefficient is not statistically significant. Hours Unsupervised 2 3 4 5 6 Overall Grades 94 86 79 71 62 Table Step 1 of 6 : Find the estimated slope, y intercept and correlation coefficient Round your answer to three decimal places. Answerarrow_forward
- Mary used a sample of 68 large U.S. cities to estimate the relationship between Crime (annual property crimes per 100,000 persons) and Income (median annual income per capita, in dollars). Her estimated regression equation was Crime = 428 + 0.050 Income. If Income decreases by 500, we would expect that Crime will Group of answer choices remain unchanged. decrease by 25. increase by 500. decrease by 50.arrow_forwardwhen a regression is used as a method of predicting dependent variables from one or more independent variables. How are the independent variables different from each other yet related to the dependent variable?arrow_forwardThe table below gives the number of hours spent unsupervised each day as well as the overall grade averages for seven randomly selected middle school students. Using this data, consider the equation of the regression line, yˆ=b0+b1x, for predicting the overall grade average for a middle school student based on the number of hours spent unsupervised each day. Keep in mind, the correlation coefficient may or may not be statistically significant for the data given. Remember, in practice, it would not be appropriate to use the regression line to make a prediction if the correlation coefficient is not statistically significant. Hours Unsupervised 0 1 1.5 2.5 4 5.5 6 Overall Grades 98 86 85 83 80 78 67 Table Step 1 of 6: Find the estimated slope, y intercept, correlation cofficient Round your answers to three decimal places.arrow_forward
- Can you please check my workarrow_forwardThe table below gives the number of hours spent unsupervised each day as well as the overall grade averages for five randomly selected middle school students. Using this data, consider the equation of the regression line, yˆ=b0+b1x, for predicting the overall grade average for a middle school student based on the number of hours spent unsupervised each day. Keep in mind, the correlation coefficient may or may not be statistically significant for the data given. Remember, in practice, it would not be appropriate to use the regression line to make a prediction if the correlation coefficient is not statistically significant. Hours Unsupervised 0 1 3 4 5 Overall Grades 95 92 85 81 62 Table Step 4 of 6 : Find the estimated value of y when x=3. Round your answer to three decimal places. Answer How to enter your answer (opens in new window)arrow_forwardThe table below gives the number of hours spent unsupervised each day as well as the overall grade averages for seven randomly selected middle school students. Using this data, consider the equation of the regression line, yˆ=b0+b1x, for predicting the overall grade average for a middle school student based on the number of hours spent unsupervised each day. Keep in mind, the correlation coefficient may or may not be statistically significant for the data given. Remember, in practice, it would not be appropriate to use the regression line to make a prediction if the correlation coefficient is not statistically significant. Hours Unsupervised 1 2 3 4 4.5 5 5.5 Overall Grades 98 95 93 90 89 72 69 Table Copy Data Step 2 of 6 : Find the estimated y-intercept. Round your answer to three decimal places.arrow_forward
- What's a good topic for a regression topic? Make sure you have two quantitative variables (for example # of siblings and heart rate). Ask for another variable like academic year, major, hobbies, favorite genre of movie. - State the independent and dependent variables and what is the population.arrow_forwardThe table below gives the number of hours spent unsupervised each day as well as the overall grade averages for five randomly selected middle school students. Using this data, consider the equation of the regression line, yˆ=b0+b1x, for predicting the overall grade average for a middle school student based on the number of hours spent unsupervised each day. Keep in mind, the correlation coefficient may or may not be statistically significant for the data given. Remember, in practice, it would not be appropriate to use the regression line to make a prediction if the correlation coefficient is not statistically significant. Hours Unsupervised 0 2 3 5 6 Overall Grades 90 89 87 77 61 Table Step 2 of 6 : Find the estimated y-intercept. Round your answer to three decimal places.arrow_forwardThe following regression equation is based on the analysis of four variables: SM_DOLLARS is the dollar amount of a watershed conservation agency's weekly spending on social media ads. RADIO_ADS is the number of radio advertisements aired weekly by the agency. WS_DOLLARS is the dollar amount of the agency’s weekly spending on web search ads. The variable WEB_VISITS is the number of weekly visitors to their educational website. These data have been recorded every week for the past three years. WEB_VISITS (expected) = 208 + 1.25*SM_DOLLARS + 1.5*RADIO_ADS + 1.2*WS_DOLLARS The data meet the assumptions for regression analysis, and the regression results, including the coefficients, were found to be statistically significant. Initially, $320 was spent on social media ads, 10 radio ads were aired, and $120 spent on web search ads. How many additional weekly web visits would you predict when the agency increases its weekly spending on social media ads by $440 without changing the…arrow_forward
arrow_back_ios
SEE MORE QUESTIONS
arrow_forward_ios
Recommended textbooks for you
 MATLAB: An Introduction with ApplicationsStatisticsISBN:9781119256830Author:Amos GilatPublisher:John Wiley & Sons Inc
 Probability and Statistics for Engineering and th...StatisticsISBN:9781305251809Author:Jay L. DevorePublisher:Cengage Learning
 Statistics for The Behavioral Sciences (MindTap C...StatisticsISBN:9781305504912Author:Frederick J Gravetter, Larry B. WallnauPublisher:Cengage Learning
 Elementary Statistics: Picturing the World (7th E...StatisticsISBN:9780134683416Author:Ron Larson, Betsy FarberPublisher:PEARSON
 The Basic Practice of StatisticsStatisticsISBN:9781319042578Author:David S. Moore, William I. Notz, Michael A. FlignerPublisher:W. H. Freeman
 Introduction to the Practice of StatisticsStatisticsISBN:9781319013387Author:David S. Moore, George P. McCabe, Bruce A. CraigPublisher:W. H. Freeman

MATLAB: An Introduction with Applications
Statistics
ISBN:9781119256830
Author:Amos Gilat
Publisher:John Wiley & Sons Inc

Probability and Statistics for Engineering and th...
Statistics
ISBN:9781305251809
Author:Jay L. Devore
Publisher:Cengage Learning

Statistics for The Behavioral Sciences (MindTap C...
Statistics
ISBN:9781305504912
Author:Frederick J Gravetter, Larry B. Wallnau
Publisher:Cengage Learning

Elementary Statistics: Picturing the World (7th E...
Statistics
ISBN:9780134683416
Author:Ron Larson, Betsy Farber
Publisher:PEARSON

The Basic Practice of Statistics
Statistics
ISBN:9781319042578
Author:David S. Moore, William I. Notz, Michael A. Fligner
Publisher:W. H. Freeman

Introduction to the Practice of Statistics
Statistics
ISBN:9781319013387
Author:David S. Moore, George P. McCabe, Bruce A. Craig
Publisher:W. H. Freeman