
MATLAB: An Introduction with Applications
6th Edition
ISBN: 9781119256830
Author: Amos Gilat
Publisher: John Wiley & Sons Inc
expand_more
expand_more
format_list_bulleted
Related questions
Question
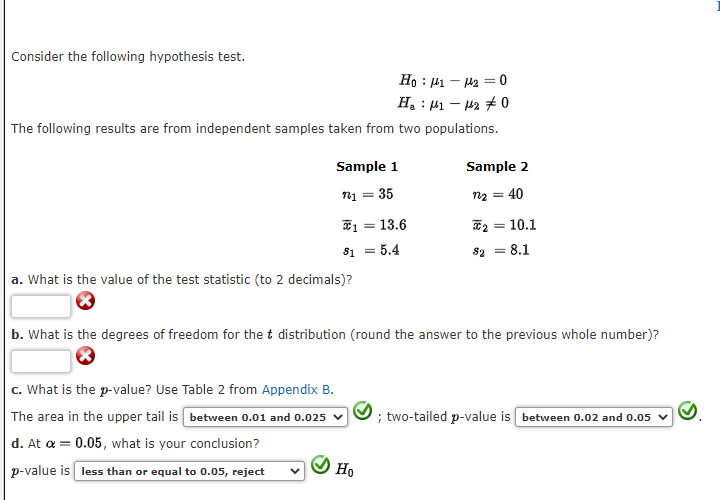

Transcribed Image Text:Consider the following hypothesis test.
H₁ H₁-H₂ = 0
H₂ : ₁ - 20
The following results are from independent samples taken from two populations.
Sample 1
721 = 35
113.6
= 5.4
$1
a. What is the value of the test statistic (to 2 decimals)?
c. What is the p-value? Use Table 2 from Appendix B.
The area in the upper tail is between 0.01 and 0.025 ✓
d. At a = 0.05, what is your conclusion?
p-value is less than or equal to 0.05, reject
Sample 2
n₂ = 40
b. What is the degrees of freedom for the distribution (round the answer to the previous whole number)?
Ho
2 = 10.1
82 = 8.1
; two-tailed p-value is between 0.02 and 0.05
Expert Solution
This question has been solved!
Explore an expertly crafted, step-by-step solution for a thorough understanding of key concepts.

This is a popular solution

Trending nowThis is a popular solution!

Step by stepSolved in 6 steps with 24 images

Knowledge Booster

Similar questions
- Questions Exercise 10.29 Algo (Inferences About the Difference Between Two Population Proportions) 1. 2. Consider the hypothesis test below. Ho P₁ P2 ≤0 Ha P1 P20 The following results are for independent samples taken from the two populations. b. With a = 0.05, what is your hypothesis testing conclusion? - Select your answer - Sample 1 n1 = 200 P1 0.23 Use pooled estimator of p. a. What is the p-value (to 4 decimals)? Use Table 1 from Appendix B. Icon Key = + Sample 2 N2 = 300 P2 = 0.15 Exercise 10.29 Algo (Inferences About the Difference Between Two Population Proportions) ◄ Question 2 of 2 Hint(s) Check My Work Hint(s) Check My Work ◄ Question 2 of 2arrow_forwardunder what circumstances we should use these statistical methods: Z-Test One sample T-test Dependent T-test Independent 2-sample T-testarrow_forwardHW10Q9arrow_forward
- I need both these questions pls help me I'll rate otherwise skip it's my requestarrow_forwardWhat is the standard error for the independent sample t statistic for the two samples? Sample 1 n = 6, SS = 56 Sample 2 n = 4, SS = 40 Select one: 2.24 9.6 12 5arrow_forwardHow do you deal with question 3 I need detailed explanationarrow_forward
- CHALLENGE ACTIVITY 7.1.3: Hypothesis test for a population proportion. 413836.2643748.qx3zqy7 Jump to level 1 An airline company is interested in improving customer satisfaction rate from the 54% currently claimed. The company sponsored a survey of 283 customers and found that 168 customers were satisfied. Determine whether sufficient evidence exists that the customer satisfaction rate is higher than the claim by the company. What is the test statistic z? Ex: 1.23 What is the p-value? Ex: 0.456 Does sufficient evidence exist that the customer satisfaction rate is different than the claim by the company at a significance level of a = 0.1? [Select Check Next 2 3 0arrow_forward(see attachment) Use technology to conduct a one-factor ANOVA to determine if the group means are equal using α=0.05α=0.05. Group means (report to 2 decimal places): Group 1: Internship: Group 2: Co-op: Group 3: Work Study: ANOVA summary statistics:F-ratio = (report accurate to 3 decimal places)p=p= (report accurate to 4 decimal places)arrow_forwardfror TIME SUBJECT ROOM AVONOW 1 INSTRUC You may need to use the appropriate appendix table or technology to answer this question. Consider the hypothesis test. Ho: P₁ P₂ ≤0 Ha: P₁ P₂ > 0 The following results are for independent samples taken from the two populations. Sample 2 A VENEMAAL 7₂ = 300 Sample n₁ = 200 P₁ = 0.24 P₂ = 0.14 (a) Calculate the test statistic. (Round your answer to two decimal places.) 2.86 You may have rounded in the wrong direction. AVAN XVԺՎՈԼԵՏarrow_forward
- K ● ● Part 2 of 4 OC. Ho: μ> 13 µg/g H₁:μ13 μg/g Listed below are the lead concentrations in µg/g measured in different traditional medicines. Use a 0.05 significance level to test the claim that the mean lead concentration for all such medicines is less than 13 µg/g. Assume that the sample is a simple random sample. 3 16.5 3 19.5 5 6 22.5 19.5 2.5 9.5 Assuming all conditions for conducting a hypothesis test are met, what are the null and alternative hypotheses? A. Ho: p=13 μg/g H₁:μ13 μg/g Determine the test statistic. (Round to two decimal places as needed.) iew an example Get more help points x Points: 0 of 1 (en OB. Ho: P=13 µg/g H₁:μ 13 µg/g D. Ho: μ-13 µg/g H₁: μ> 13 μg/g tv Clear all Save MA Check answer W rect:arrow_forwardMen Women μ μ1 μ2 n 11 59 x 97.72 97.34 s 0.83 0.63 A study was done on the body temperatures of men and women. The results are shown in the table. Assume that the two samples are independent simple random samples selected from normally distributed? populations, and do not assume that the population standard deviations are equal. Complete parts? (a) and? (b) below. Use a 0.05 significance level to test the claim that men have a higher mean body temperature than women. a. What are the null and alternative hypotheses? The test statistic, t, is The P-value is State the conclusion for the test. b. Construct a confidence interval suitable for testing the claim that the two samples are from populations with the same mean.arrow_forwardDrug Trial ProblemClinical trials for a drug was conducted using a treatment group and a placebo group. The results are shown in the table below. Treatment Placebo μ μ₁ μ₂ n 33 38 x̄ 2.31 2.87 s 0.85 0.71 Use a 0.05 significance level to test the claim that the two samples are from populations with different means. State the claim, null, and alternative hypothesis. Claim: μ1 μ2 HO: μ1 μ2 H1: μ1 μ2arrow_forward
arrow_back_ios
SEE MORE QUESTIONS
arrow_forward_ios
Recommended textbooks for you
- MATLAB: An Introduction with ApplicationsStatisticsISBN:9781119256830Author:Amos GilatPublisher:John Wiley & Sons Inc
 Probability and Statistics for Engineering and th...StatisticsISBN:9781305251809Author:Jay L. DevorePublisher:Cengage Learning
 Statistics for The Behavioral Sciences (MindTap C...StatisticsISBN:9781305504912Author:Frederick J Gravetter, Larry B. WallnauPublisher:Cengage Learning
  Elementary Statistics: Picturing the World (7th E...StatisticsISBN:9780134683416Author:Ron Larson, Betsy FarberPublisher:PEARSON
 The Basic Practice of StatisticsStatisticsISBN:9781319042578Author:David S. Moore, William I. Notz, Michael A. FlignerPublisher:W. H. Freeman
 Introduction to the Practice of StatisticsStatisticsISBN:9781319013387Author:David S. Moore, George P. McCabe, Bruce A. CraigPublisher:W. H. Freeman
MATLAB: An Introduction with Applications
Statistics
ISBN:9781119256830
Author:Amos Gilat
Publisher:John Wiley & Sons Inc
Probability and Statistics for Engineering and th...
Statistics
ISBN:9781305251809
Author:Jay L. Devore
Publisher:Cengage Learning
Statistics for The Behavioral Sciences (MindTap C...
Statistics
ISBN:9781305504912
Author:Frederick J Gravetter, Larry B. Wallnau
Publisher:Cengage Learning
Elementary Statistics: Picturing the World (7th E...
Statistics
ISBN:9780134683416
Author:Ron Larson, Betsy Farber
Publisher:PEARSON
The Basic Practice of Statistics
Statistics
ISBN:9781319042578
Author:David S. Moore, William I. Notz, Michael A. Fligner
Publisher:W. H. Freeman
Introduction to the Practice of Statistics
Statistics
ISBN:9781319013387
Author:David S. Moore, George P. McCabe, Bruce A. Craig
Publisher:W. H. Freeman