
MATLAB: An Introduction with Applications
6th Edition
ISBN: 9781119256830
Author: Amos Gilat
Publisher: John Wiley & Sons Inc
expand_more
expand_more
format_list_bulleted
Related questions
Question
thumb_up100%

Transcribed Image Text:Q1
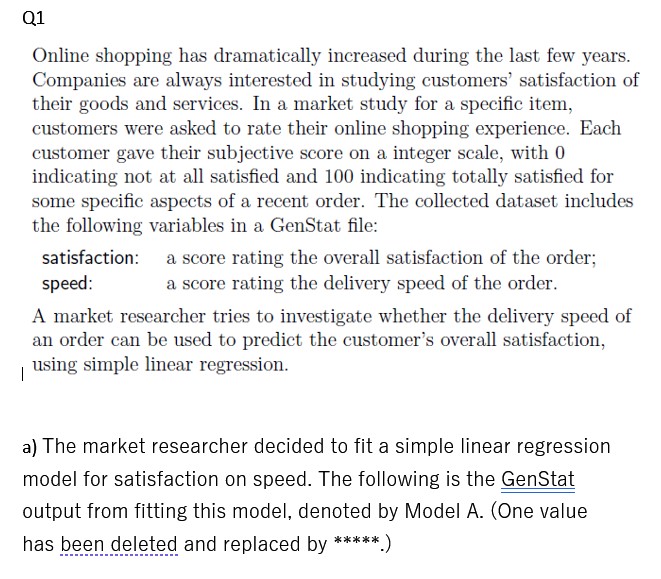
Online shopping has dramatically increased during the last few years.
Companies are always interested in studying customers' satisfaction of
their goods and services. In a market study for a specific item,
customers were asked to rate their online shopping experience. Each
customer gave their subjective score on a integer scale, with 0
indicating not at all satisfied and 100 indicating totally satisfied for
some specific aspects of a recent order. The collected dataset includes
the following variables in a GenStat file:
satisfaction:
speed:
A market researcher tries to investigate whether the delivery speed of
an order can be used to predict the customer's overall satisfaction,
using simple linear regression.
|
a score rating the overall satisfaction of the order;
a score rating the delivery speed of the order.
a) The market researcher decided to fit a simple linear regression
model for satisfaction on speed. The following is the GenStat
output from fitting this model, denoted by Model A. (One value
has been deleted and replaced by *****.)

Transcribed Image Text:Model A
Regression analysis
Response variate: satisfaction
Fitted terms: Constant, speed
Summary of analysis
Source
Regression
Residual
Total
d.f.
S.S.
m.s.
1
3670
3669.58
96
4152
43.25
97
7822
80.64
Percentage variance accounted for 46.4
Standard error of observations is estimated to be 6.58.
Message: the following units have large standardized residuals.
Response
Residual
32.00
-2.60
31.00
-2.68
Unit
1
93
Message: the following units have high leverage.
Response
Leverage
0.082
0.059
Unit
38
94
29.00
25.00
Estimates of parameters
Parameter estimate
Constant
speed
30.09
0.4611
s.e.
1.88
*****
v.r.
84.84
t(96)
16.00
9.21
F pr.
<.001
t pr.
<.001
<.001
(i) From the GenStat output above derive the sample size. (Do
not attempt to count the points in Figure 1!)
(ii) Calculate the estimated standard error of the parameter
associated with speed.
(iii) The output for Model A gives the required information to
test the hypothesis that the slope of the regression line is
zero. Give the value of the test statistic and report the results
of this test, stating your conclusion clearly.
Expert Solution
This question has been solved!
Explore an expertly crafted, step-by-step solution for a thorough understanding of key concepts.

Step by stepSolved in 4 steps with 3 images

Knowledge Booster

Similar questions
- ANOVA. Dr. Milgramm is conducting a patient satisfaction survey, rating how well her patients like her on a scale of 1-10. Her patients tend to fall into three categories: “Like a lot”, “like somewhat”, and “dislike a lot”. She believes that she might get different satisfaction scores from people in each group, but (because she's not great at numbers) she wants you to do an ANOVA to be sure. She has collected data from 12 patients (three equal groups) with the following results. Group 1) “Like a lot” Mean: 8 SS: 2 N: df: Group 2) “Like somewhat” Mean: 5 SS: 6 N: df: Group 3) “Dislike a lot” Mean: 2 SS: 4 N: df: Grand Mean: df Within-Group:__________ df Between-Groups:___________ Estimated Variance (S21) for Group 1: _______ Estimated Variance (S22) for Group 2: ___________ Estimated…arrow_forwardSurveys always provide data that is 100% accurate from feedback from participants True or Falsearrow_forwardThe price drivers pay for gasoline often varies a great deal across regions throughout the United States. The following data show the price per gallon for regular gasoline for a random sample of gasoline service stations for three major brands of gasoline (Shell, BP, and Marathon) located in eleven metropolitan areas across the upper Midwest region (OhioGasPrices.com website, March 18, 2012). Click on the datafile logo to reference the data. DATA file Shell BP Metropolitan Area Marathon Akron, Ohio Cincinnati, Ohio Cleveland, Ohio Columbus, Ohio Ft. Wayne, Indiana Indianapolis, Indiana Lansing, Michigan Lexington, Kentucky Louisville, Kentucky Muncie, Indiana Toledo, Ohio 3.77 3.72 3.87 3.76 3.78 3.87 3.89 3.79 3.83 3.83 3.85 3.77 3.83 3.85 3.93 3.84 3.84 4.04 3.87 3.87 3.99 3.79 3.78 3.81 3.69 3.78 3.84 3.84 3.83 3.79 3.79 3.86 3.86 Use a = .05 to test for any significant difference in the mean price of gasoline for the three brands. Round SS to 6 decimals, MS to 6 decimals, F to 2…arrow_forward
- The following statistics represent weekly salaries at a construction company. Mean $620 First quartile $485 Median $540 Third quartile $600 Mode $535 94th percentile $683 The most common salary is $ The salary that half the employees' salaries surpass is $ The percent of employees' salaries that surpassed $600 is The percent of employees' salaries that were less than $485 is %. The percent of employees' salaries that surpassed $683 is %. If the company has 100 employees, the total weekly salary of all employees is $ %.arrow_forwardA social media app is conducting a study on the amount of time users spend on the app. They collect the following variables. Age Years: How old they are in years? Income: Monthly Income Location: What country do they live in? Device: Do they use an iPhone, Samsung, other? Service: Who provides their mobile phone service? For example: T-Mobile, At&t, Verizon, ect Hours: How many hours do they spend on the app per week. A) Which variable could the research construct a one proportion z-interval for? B) The social media app just launched a new algorithm that suggest content in an effort to increase the amount of time the user spends on the app. The researchers want to use the survey results to see if there is statistically significant evidence that on average users spend more than 10 hours per week on the social media app. The researchers found in their sample of 44 users, the mean hours spent on the app is 10.5 hours with a standard deviation of 5.675 hours. Which type of hypothesis test…arrow_forwardhelp pleasearrow_forward
- Government economic studies reveal that young adults, not middle-aged or older adults, are having the most difficult time in today’s economy. Although the nation’s labor market shows a decline in the unemployment rate, the percentage of young adults, ages 18 to 24, currently employed (54 percent) is at the lowest level since the government data collection began in 1948. If you were working for a national survey organization doing a general public survey of young adults and older adults, what topics and questions would you design into your survey to elaborate on this finding?arrow_forwardConsidering yourselves to be observational units, explain why the following are not variables: Average amount of hours worked in the past 24 hours among students in our class. Proportion of students in our class who are first-generation college students Have left-handers read more Harry Potter books, on average, compared to right-handers?arrow_forwardTime Spent Studying and Social Mediaarrow_forward
- Some research situations are summarized below. For each situation, identify all variables.Then, for each variable, note the level of measurement AND whether it is an independent or dependent variable. a.Ahealth researcher is interested in studying patient compliance (whether or not patients take the medicine their doctor prescribes). She surveys 800 diabetic patients, and finds compliance to be linked to patient age, education, gender, and socioeconomic status. b. A market researcher is hired by Target to see how customers buying habits have changed before and after COVID. The researcher studies how much each customer spent (in $s), how frequently they visited the website each month, how frequently they visited the store each month. They report that, since March, customers are spending less, visiting the website more frequently, and shopping in person less frequently.arrow_forwardYou are a manager for Company ABC and decide to compile data and analyze your employees’ level of satisifaction. You create a survey to ask each employee to rate their level of satisfaction working at Company ABC. Table 1 shows data of 15 people employees that responded to your survey. Each of the employees have the same job title: Sales Representative. The data set includes variables regarding an employee ID, gender, ethnicity, region, pay rate, employee satisfaction rating. Each employee was asked to rate their level of satisfaction working at Company ABC. A composite score from 0 (lowest) to 5 (highest) is shown as the data variable employee satisfaction. Table 1: Employee Data on 15 Sales Representatives at Company ABCarrow_forwardThe director of surgery at a local hospital is interested in understanding his unit’s costs. An assistant collected data for the past 36 months on unit cost (labor, supplies, and so on) along with the number of procedures performed in the unit. The assistant analyzed the data using a spreadsheet program, and the following output was generated. Equation Intercept $ 1,006,000 Coefficient on procedures $ 230 Statistical data Correlation coefficient 0.518 R2 0.268 The unit is planning to perform an average 18,5000 procedures per month for the coming year. Required A: Use the regression output to write the surgical unit cost equation. Surgical unit cost = ____________ + __________ x Procedures Required B: Based on the cost equation,…arrow_forward
arrow_back_ios
arrow_forward_ios
Recommended textbooks for you
- MATLAB: An Introduction with ApplicationsStatisticsISBN:9781119256830Author:Amos GilatPublisher:John Wiley & Sons Inc
 Probability and Statistics for Engineering and th...StatisticsISBN:9781305251809Author:Jay L. DevorePublisher:Cengage Learning
 Statistics for The Behavioral Sciences (MindTap C...StatisticsISBN:9781305504912Author:Frederick J Gravetter, Larry B. WallnauPublisher:Cengage Learning
  Elementary Statistics: Picturing the World (7th E...StatisticsISBN:9780134683416Author:Ron Larson, Betsy FarberPublisher:PEARSON
 The Basic Practice of StatisticsStatisticsISBN:9781319042578Author:David S. Moore, William I. Notz, Michael A. FlignerPublisher:W. H. Freeman
 Introduction to the Practice of StatisticsStatisticsISBN:9781319013387Author:David S. Moore, George P. McCabe, Bruce A. CraigPublisher:W. H. Freeman
MATLAB: An Introduction with Applications
Statistics
ISBN:9781119256830
Author:Amos Gilat
Publisher:John Wiley & Sons Inc
Probability and Statistics for Engineering and th...
Statistics
ISBN:9781305251809
Author:Jay L. Devore
Publisher:Cengage Learning
Statistics for The Behavioral Sciences (MindTap C...
Statistics
ISBN:9781305504912
Author:Frederick J Gravetter, Larry B. Wallnau
Publisher:Cengage Learning
Elementary Statistics: Picturing the World (7th E...
Statistics
ISBN:9780134683416
Author:Ron Larson, Betsy Farber
Publisher:PEARSON
The Basic Practice of Statistics
Statistics
ISBN:9781319042578
Author:David S. Moore, William I. Notz, Michael A. Fligner
Publisher:W. H. Freeman
Introduction to the Practice of Statistics
Statistics
ISBN:9781319013387
Author:David S. Moore, George P. McCabe, Bruce A. Craig
Publisher:W. H. Freeman