MATLAB: An Introduction with Applications
6th Edition
ISBN: 9781119256830
Author: Amos Gilat
Publisher: John Wiley & Sons Inc
expand_more
expand_more
format_list_bulleted
Question
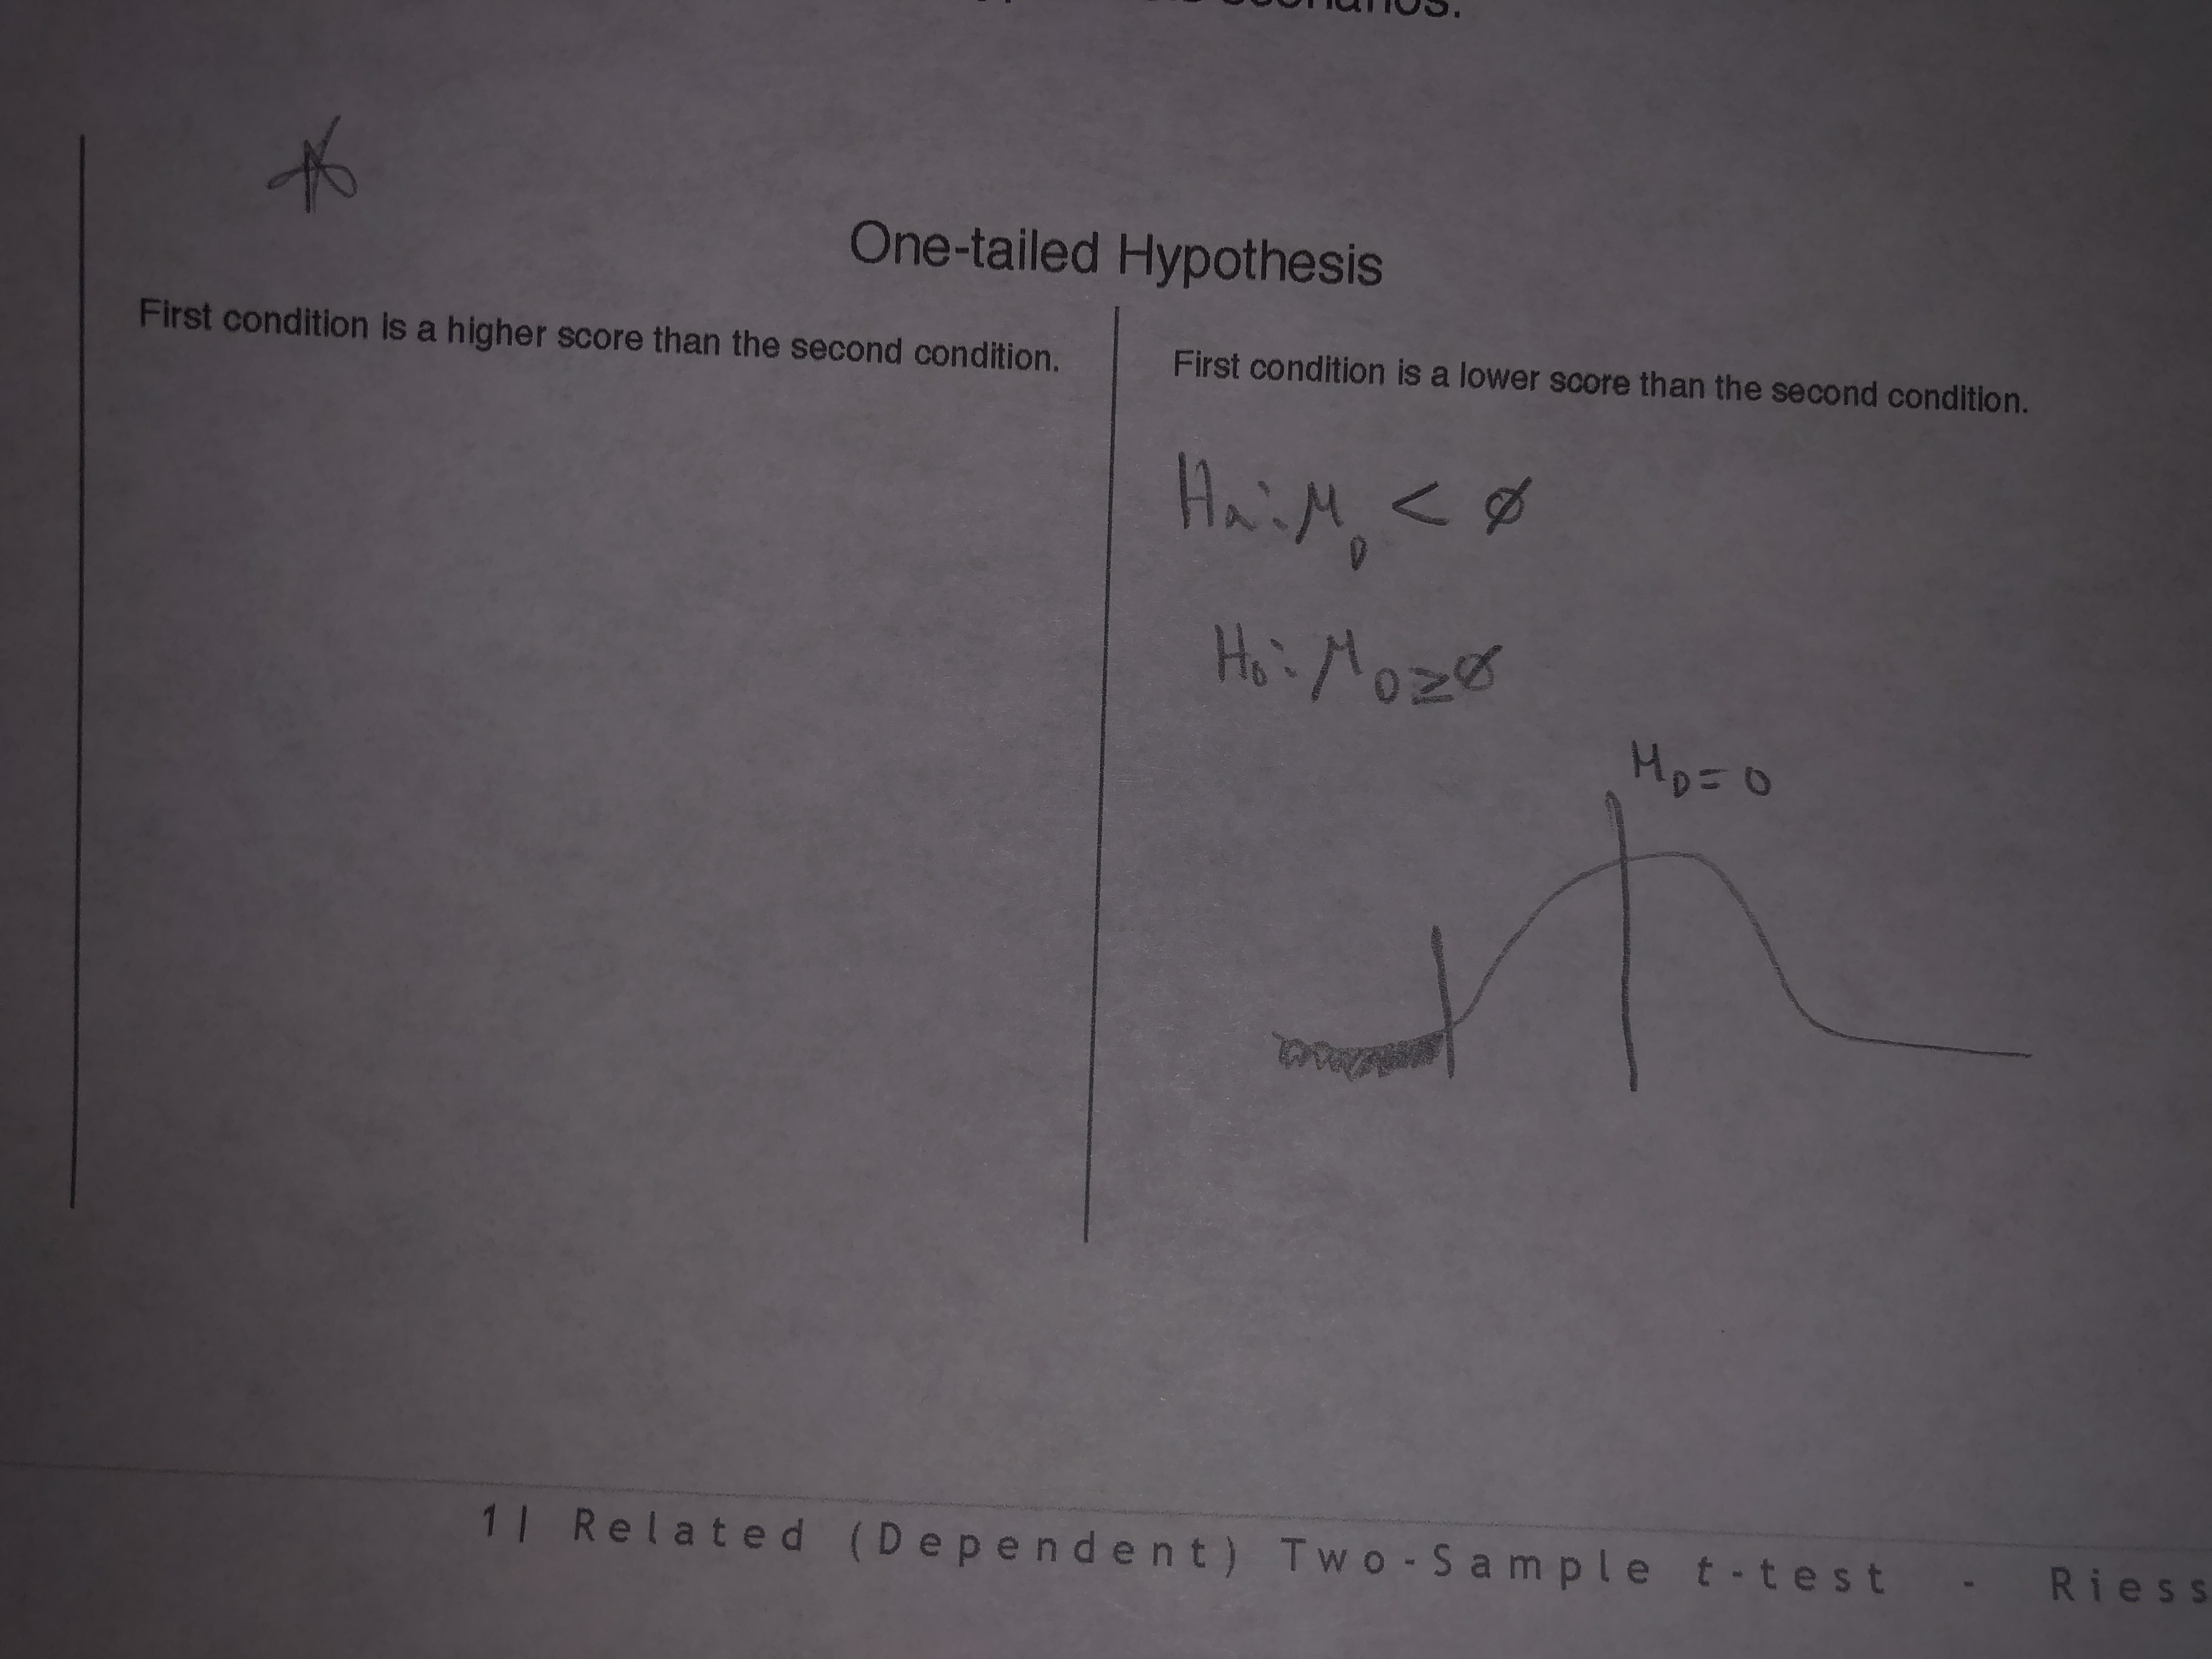
Write the statistical hypotheses and draw the

Transcribed Image Text:One-tailed Hypothesis
First condition is a higher score than the second condition.
First condition is a lower score than the second condition.
HaiM<ø
HoiMozea
Hp=0
11 Related (Dependent) Two-S ample t-test- Riess
Expert Solution
This question has been solved!
Explore an expertly crafted, step-by-step solution for a thorough understanding of key concepts.
This is a popular solution
Trending nowThis is a popular solution!
Step by stepSolved in 2 steps with 2 images

Knowledge Booster
Learn more about
Need a deep-dive on the concept behind this application? Look no further. Learn more about this topic, statistics and related others by exploring similar questions and additional content below.Similar questions
- Generate 10000 instances of a poisson (10) random variable and then compute the sample mean, sample variance, and sample standard deviation.arrow_forwardA large car dealership claims that 47% of its customers are looking to buy a sport utility vehicle (SUV). A random sample of 61 customers is surveyed. What is the probability that less than 40% of the sample are looking to buy an SUV? Your answer should be from the cumulative normal distribution table.arrow_forwardA mobile game currently has 38% of the market share. The CEO of the company producing the game recently authorized an advertising campaign with the goal of increasing the game's market share. A random sample of 1041 mobile gamers found that 409 gamers played the game at least once a day. A .Setup the null and alternative hypotheses to see if there is a significant change in the market share of the game. B. Determine if you can use a normal model to approximate the distribution of sample proportions. C. Find the critical value for a level of significance of 0.03. D. Find the standardized test statistic. E. State the conclusion of the hypothesis test.arrow_forward
- In Bayesian statistics, a 90% credible interval (or Bayes interval) covers the true parameter with (subjective) probability 90%. True Falsearrow_forward2. When we carry out a 1-sample hypothesis test for the mean, one of the ways that we can check for normality is to look at the normal plot. How do we know if our normality assumption is satisfied by looking at the normal plot? Be as specific as possible.arrow_forwardThe Jamestown Steel Company manufactures and assembles desks and other office equipment at several plants. The weekly production of the Model A325 desk follows a normal probability distribution, with a mean of 200 and a standard deviation of 16. Recently, due to market expansion, new production methods have been introduced and new employees hired. The vice president of manufacturing would like to investigate whether there has been a change in the weekly production of the Model A325 desk. To put it another way, is the mean number of desks produced different from 200 at the 0.01 significance level? If the VP took a sample of new production, where he took the data for 50 weeks and found the average production to be 203.5 desks, what would you conclude?arrow_forward
- The starting salaries of financial accountants are positively skewed, with a mean of $52,000 and a standard deviation of $12,000. The starting salaries of cost accountants have a slightly skewed distribution, with a mean of $58,000 and a standard deviation of $14,000. A random sample of 40 financial accountants and a random sample of 50 cost accountants are selected. What is the probability that the starting salaries of the financial accountants will not exceed the starting salaries of A Round the final cost accountants? answer to four decimal places.arrow_forwardAn HIV clinical trial with 1151 subjects was conducted. We will focus on two variables from this trial: IVDrug and Age. IVDrug is a categorical variable that indicates whether each subject never, previously, or currently uses IV drugs. Age lists the subject's age in year. Thus, we have age for subjects in three treatment groups. Assume that the samples were collected independently and come from a normally distributed population with equal variances. An ANOVA is used to test whether average age in the three IV drug groups is the same. A partially filled-in ANOVA table is listed below. Use a significance level of 0.05. p-value Treatment Error Total df SS MS 76.77 F 7.5586arrow_forward
arrow_back_ios
arrow_forward_ios
Recommended textbooks for you
 MATLAB: An Introduction with ApplicationsStatisticsISBN:9781119256830Author:Amos GilatPublisher:John Wiley & Sons Inc
 Probability and Statistics for Engineering and th...StatisticsISBN:9781305251809Author:Jay L. DevorePublisher:Cengage Learning
 Statistics for The Behavioral Sciences (MindTap C...StatisticsISBN:9781305504912Author:Frederick J Gravetter, Larry B. WallnauPublisher:Cengage Learning
 Elementary Statistics: Picturing the World (7th E...StatisticsISBN:9780134683416Author:Ron Larson, Betsy FarberPublisher:PEARSON
 The Basic Practice of StatisticsStatisticsISBN:9781319042578Author:David S. Moore, William I. Notz, Michael A. FlignerPublisher:W. H. Freeman
 Introduction to the Practice of StatisticsStatisticsISBN:9781319013387Author:David S. Moore, George P. McCabe, Bruce A. CraigPublisher:W. H. Freeman

MATLAB: An Introduction with Applications
Statistics
ISBN:9781119256830
Author:Amos Gilat
Publisher:John Wiley & Sons Inc

Probability and Statistics for Engineering and th...
Statistics
ISBN:9781305251809
Author:Jay L. Devore
Publisher:Cengage Learning

Statistics for The Behavioral Sciences (MindTap C...
Statistics
ISBN:9781305504912
Author:Frederick J Gravetter, Larry B. Wallnau
Publisher:Cengage Learning

Elementary Statistics: Picturing the World (7th E...
Statistics
ISBN:9780134683416
Author:Ron Larson, Betsy Farber
Publisher:PEARSON

The Basic Practice of Statistics
Statistics
ISBN:9781319042578
Author:David S. Moore, William I. Notz, Michael A. Fligner
Publisher:W. H. Freeman

Introduction to the Practice of Statistics
Statistics
ISBN:9781319013387
Author:David S. Moore, George P. McCabe, Bruce A. Craig
Publisher:W. H. Freeman