MATLAB: An Introduction with Applications
6th Edition
ISBN: 9781119256830
Author: Amos Gilat
Publisher: John Wiley & Sons Inc
expand_more
expand_more
format_list_bulleted
Concept explainers
Question
thumb_up100%

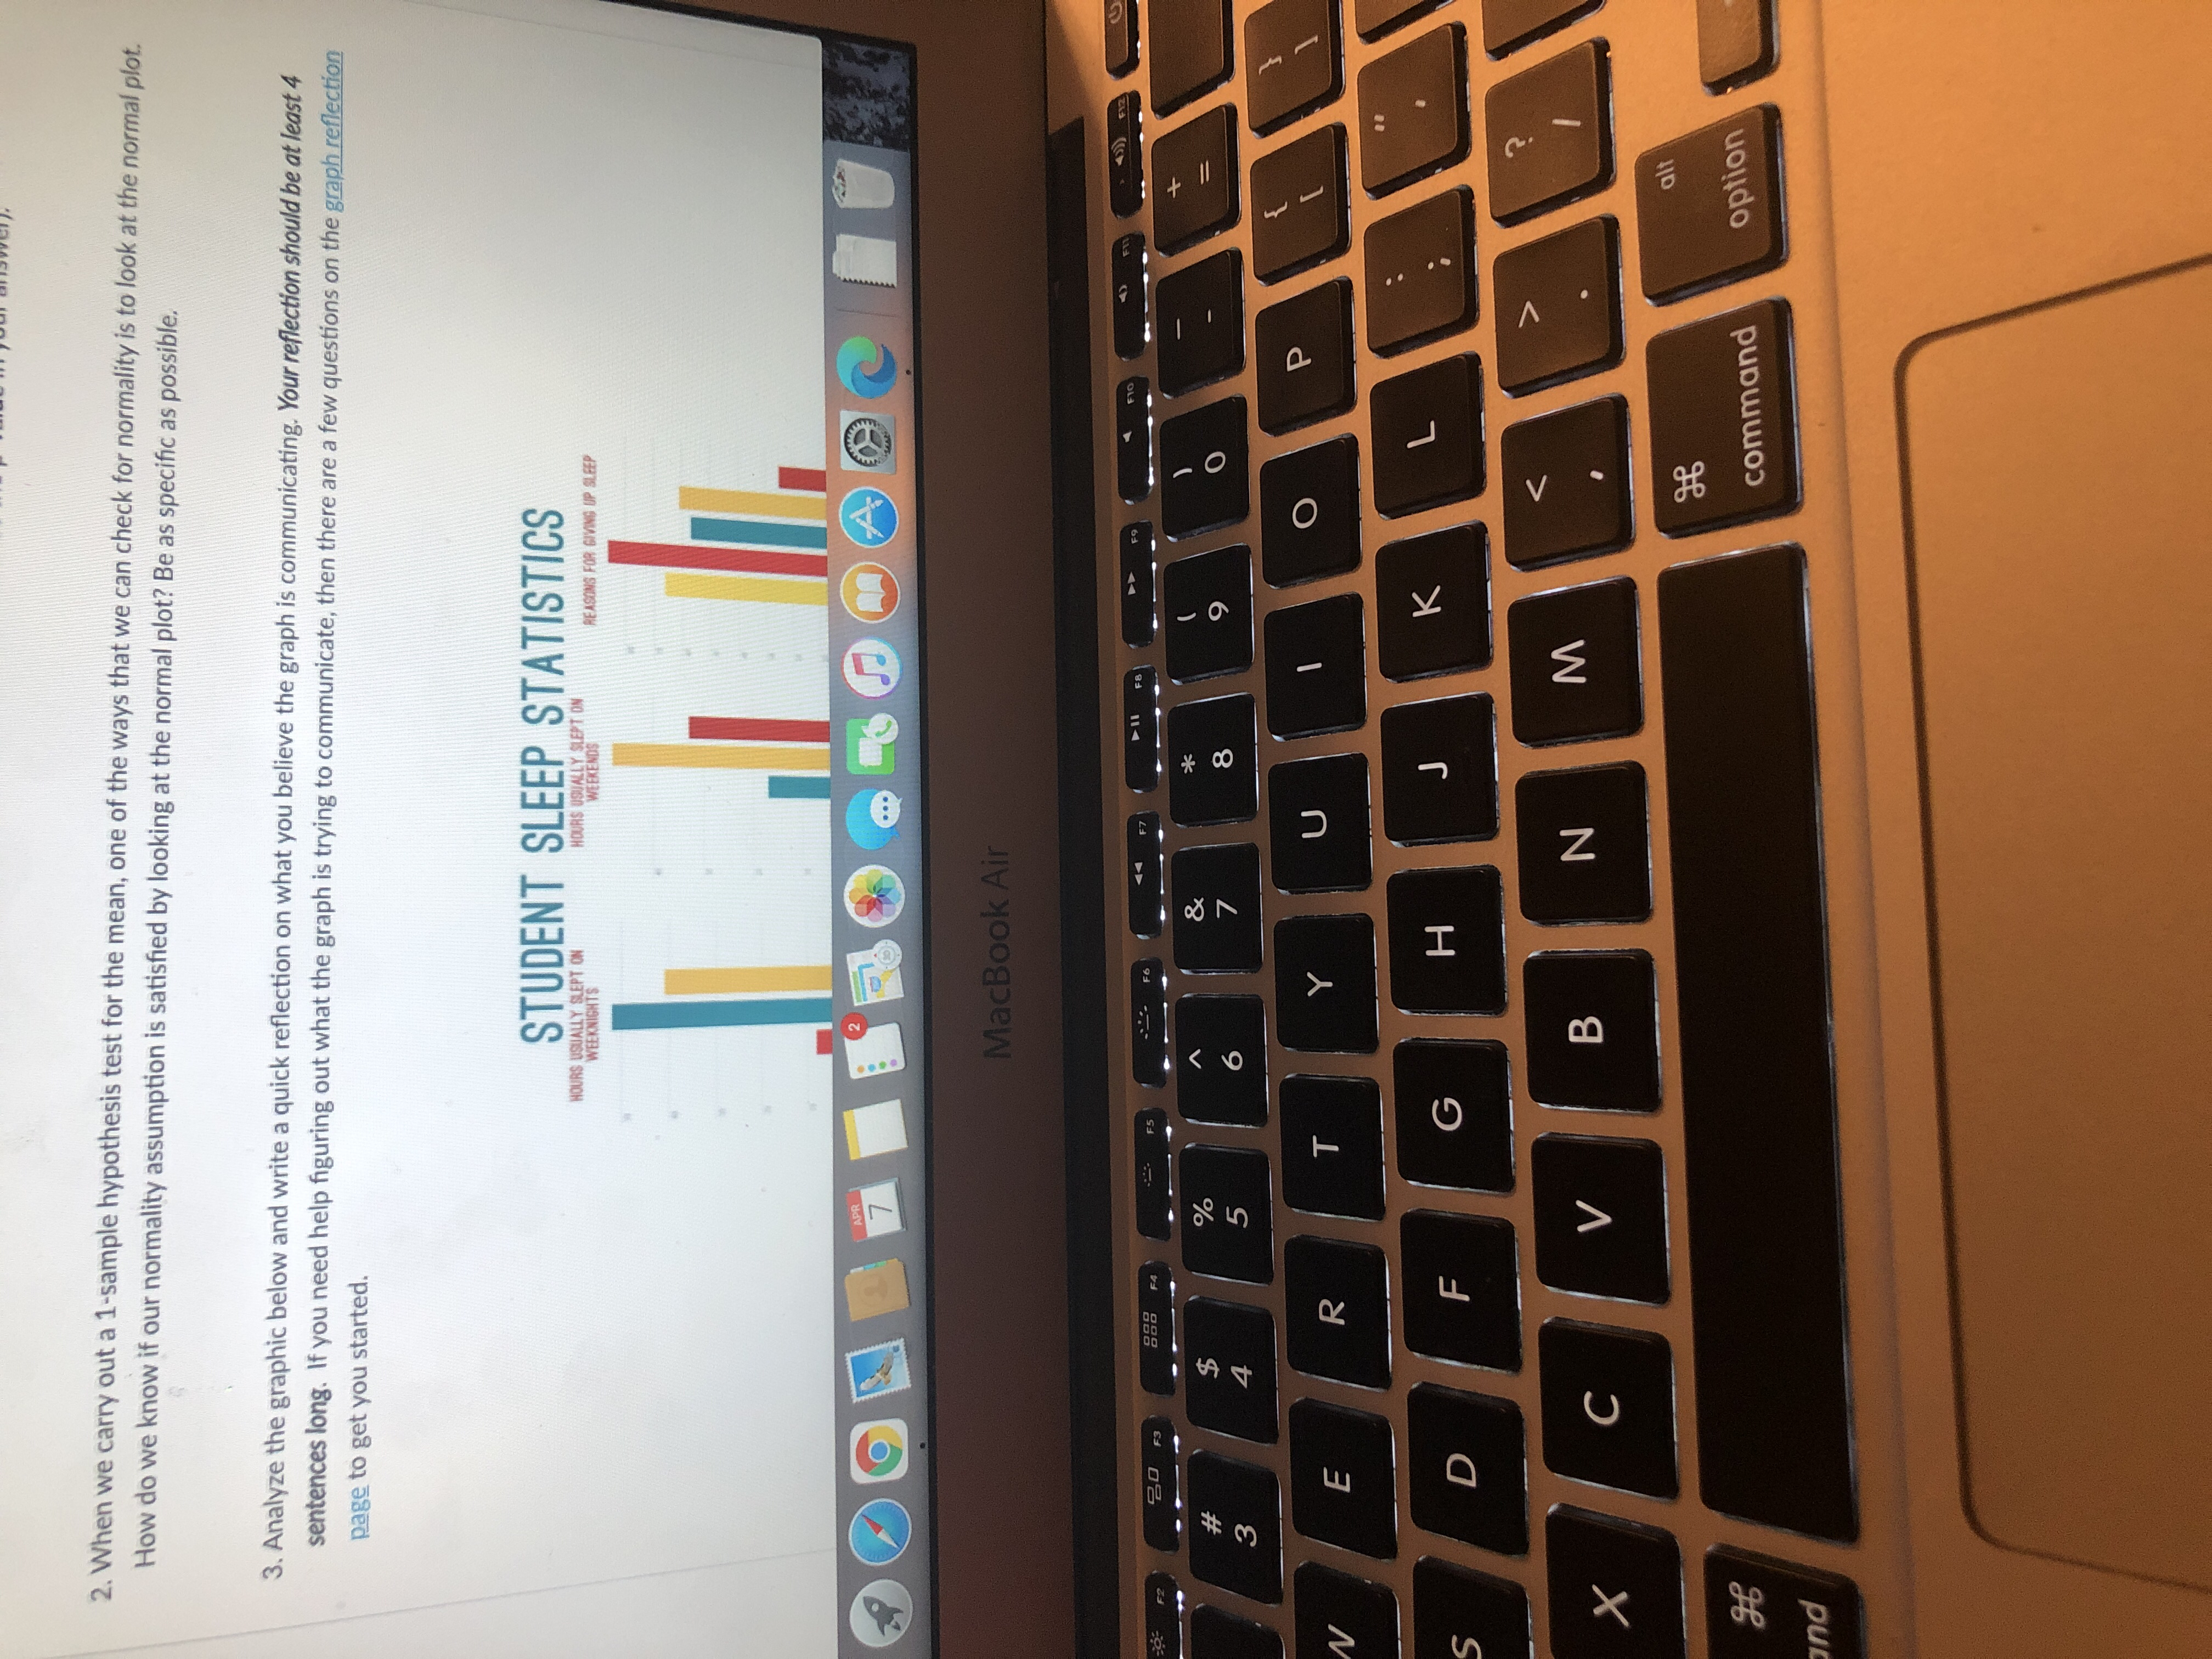
Transcribed Image Text:2. When we carry out a 1-sample hypothesis test for the mean, one of the ways that we can check for normality is to look at the normal plot.
How do we know if our normality assumption is satisfied by looking at the normal plot? Be as specific as possible.
Expert Solution
This question has been solved!
Explore an expertly crafted, step-by-step solution for a thorough understanding of key concepts.
Step by stepSolved in 2 steps

Knowledge Booster
Learn more about
Need a deep-dive on the concept behind this application? Look no further. Learn more about this topic, statistics and related others by exploring similar questions and additional content below.Similar questions
- IQ tests are approximately normally distributed with a mean of 100 for adults. A tech company CEO wants to conduct a hypothesis test to see if the average IQ of employees at high-tech firms in California is higher than average. What is Type I error in the context of this problem?arrow_forwardSelect all true statements below (Multiple or none can be true). With a large, representative sample, the histogram of the sample data will follow the normal curve closely. If two lists of numbers have exactly the same average of 50 and SD of 10, then the percentage of entries between 40 and 60 must be exactly the same for both lists. Half of a list of numbers is always below its average. The median and average of a list of numbers are not necessarily close together.arrow_forwardA random sample of 10,000 bottles of cola was taken to see whether the mean weight was 16 fluid ounces, as marked on the container. The null hypothesis is that the population mean is 16 ounces. Use the read-out below to test the hypothesis that the colas do not have a population mean of 16 fluid ounces. You do not have to do any calculations; just interpret the given data clearly and thoroughly in the context of the problem. | One-Sample T: ounces Test of u = 16 vs = 16 Variable Mean StDev SE Mean 95 CI T P ounces 10000 15.9988 0.0985 0.0010 (15.9969, 16.0007) -1.21 0.225arrow_forward
- Professor Nord stated that the mean score on the final exam from all the years he has been teaching is a 79%. Colby was in his most recent class, and his class’s mean score on the final exam was 82%. Colby decided to run a hypothesis test to determine if the mean score of his class was significantly greater than the mean score of the population. α = .01. What is the mean score of the population? What is the mean score of the sample? Is this test one-tailed or two-tailed? Why?arrow_forwardWhich of these experimental designs has the most statistical power (is more likely to show a true difference between 2 treatment conditions)? A. Between-Subjects B. Descriptive Study C. Correlational Study D. Within-Subjectsarrow_forwardIf you look at the differences between the means, once with 10 participants and one mean with 20 participants. (same data set) One mean difference is very large, but non-significant and the other is very small, but came out significant. What could be the reason for this outcome? (My difference in means was with 10 participants: -1.1 and with 20 participants: -5.1)arrow_forward
- Describe a study in which you can use both nonparametric and parametric statistics. A researcher has participants expecting to receive either painful or mild electrical shocks during a study wait in a quarter-full waiting room with other participants. He then measures whether they choose to sit next to other participants or if they sit far away on their own. What is the best test to run for this study and why?arrow_forwardwhat is the variance of the mean squared errors for this data setarrow_forward
arrow_back_ios
arrow_forward_ios
Recommended textbooks for you
 MATLAB: An Introduction with ApplicationsStatisticsISBN:9781119256830Author:Amos GilatPublisher:John Wiley & Sons Inc
 Probability and Statistics for Engineering and th...StatisticsISBN:9781305251809Author:Jay L. DevorePublisher:Cengage Learning
 Statistics for The Behavioral Sciences (MindTap C...StatisticsISBN:9781305504912Author:Frederick J Gravetter, Larry B. WallnauPublisher:Cengage Learning
 Elementary Statistics: Picturing the World (7th E...StatisticsISBN:9780134683416Author:Ron Larson, Betsy FarberPublisher:PEARSON
 The Basic Practice of StatisticsStatisticsISBN:9781319042578Author:David S. Moore, William I. Notz, Michael A. FlignerPublisher:W. H. Freeman
 Introduction to the Practice of StatisticsStatisticsISBN:9781319013387Author:David S. Moore, George P. McCabe, Bruce A. CraigPublisher:W. H. Freeman

MATLAB: An Introduction with Applications
Statistics
ISBN:9781119256830
Author:Amos Gilat
Publisher:John Wiley & Sons Inc

Probability and Statistics for Engineering and th...
Statistics
ISBN:9781305251809
Author:Jay L. Devore
Publisher:Cengage Learning

Statistics for The Behavioral Sciences (MindTap C...
Statistics
ISBN:9781305504912
Author:Frederick J Gravetter, Larry B. Wallnau
Publisher:Cengage Learning

Elementary Statistics: Picturing the World (7th E...
Statistics
ISBN:9780134683416
Author:Ron Larson, Betsy Farber
Publisher:PEARSON

The Basic Practice of Statistics
Statistics
ISBN:9781319042578
Author:David S. Moore, William I. Notz, Michael A. Fligner
Publisher:W. H. Freeman

Introduction to the Practice of Statistics
Statistics
ISBN:9781319013387
Author:David S. Moore, George P. McCabe, Bruce A. Craig
Publisher:W. H. Freeman