Microeconomics
13th Edition
ISBN: 9781337617406
Author: Roger A. Arnold
Publisher: Cengage Learning
expand_more
expand_more
format_list_bulleted
Question

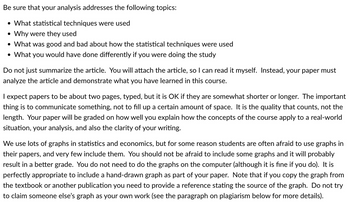
Transcribed Image Text:Be sure that your analysis addresses the following topics:
• What statistical techniques were used
• Why were they used
• What was good and bad about how the statistical techniques were used
• What you would have done differently if you were doing the study
Do not just summarize the article. You will attach the article, so I can read it myself. Instead, your paper must
analyze the article and demonstrate what you have learned in this course.
I expect papers to be about two pages, typed, but it is OK if they are somewhat shorter or longer. The important
thing is to communicate something, not to fill up a certain amount of space. It is the quality that counts, not the
length. Your paper will be graded on how well you explain how the concepts of the course apply to a real-world
situation, your analysis, and also the clarity of your writing.
We use lots of graphs in statistics and economics, but for some reason students are often afraid to use graphs in
their papers, and very few include them. You should not be afraid to include some graphs and it will probably
result in a better grade. You do not need to do the graphs on the computer (although it is fine if you do). It is
perfectly appropriate to include a hand-drawn graph as part of your paper. Note that if you copy the graph from
the textbook or another publication you need to provide a reference stating the source of the graph. Do not try
to claim someone else's graph as your own work (see the paragraph on plagiarism below for more details).

Transcribed Image Text:One short paper is optional and you can earn up to 5 additional percentage points towards your final course
grade as extra credit. Find a recent article (published in 2024) from a newspaper, magazine or academic journal
(either print or online) about economics, business or social science which makes use of some of the statistical
concepts you have learned in this course. Then write a short analysis explaining how what you learned in this
course applies to what is discussed in the article. Good sources for articles would be The Wall Street Journal,
Business Week or The Economist, but you can also find applicable articles in the San Francisco Chronicle, the New
York Times, or other general newspapers or news magazines.
Expert Solution
This question has been solved!
Explore an expertly crafted, step-by-step solution for a thorough understanding of key concepts.
Step by stepSolved in 2 steps with 2 images

Knowledge Booster
Similar questions
- Dropping University Courses Students doing poorly in courses often consider dropping the courses. Many universities will offer a refund before a certain date. Should this affect a students drop decision?arrow_forwardConcert Opportunity Cost 2 You were able to purchase two tickets to an upcoming concert for $100 apiece when the concert was first announced three months ago. Recently, you saw that StubHub was listing similar seats for $225 apiece. What does it cost you to attend the concert?arrow_forward
Recommended textbooks for you


 Economics (MindTap Course List)EconomicsISBN:9781337617383Author:Roger A. ArnoldPublisher:Cengage Learning
 Managerial Economics: A Problem Solving ApproachEconomicsISBN:9781337106665Author:Luke M. Froeb, Brian T. McCann, Michael R. Ward, Mike ShorPublisher:Cengage Learning
 Economics Today and Tomorrow, Student EditionEconomicsISBN:9780078747663Author:McGraw-HillPublisher:Glencoe/McGraw-Hill School Pub Co
 Microeconomics: Principles & PolicyEconomicsISBN:9781337794992Author:William J. Baumol, Alan S. Blinder, John L. SolowPublisher:Cengage Learning


Economics (MindTap Course List)
Economics
ISBN:9781337617383
Author:Roger A. Arnold
Publisher:Cengage Learning

Managerial Economics: A Problem Solving Approach
Economics
ISBN:9781337106665
Author:Luke M. Froeb, Brian T. McCann, Michael R. Ward, Mike Shor
Publisher:Cengage Learning

Economics Today and Tomorrow, Student Edition
Economics
ISBN:9780078747663
Author:McGraw-Hill
Publisher:Glencoe/McGraw-Hill School Pub Co

Microeconomics: Principles & Policy
Economics
ISBN:9781337794992
Author:William J. Baumol, Alan S. Blinder, John L. Solow
Publisher:Cengage Learning