A First Course in Probability (10th Edition)
10th Edition
ISBN: 9780134753119
Author: Sheldon Ross
Publisher: PEARSON
expand_more
expand_more
format_list_bulleted
Question

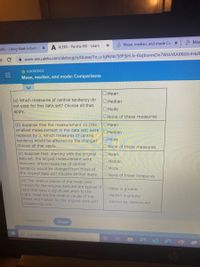
Transcribed Image Text:**Title: Comparing Measures of Central Tendency**
**a) Which measures of central tendency do not exist for this data set? Choose all that apply.**
Options:
- Mean
- Median
- Mode
- None of these measures
**b) Suppose that the measurement 15 (the smallest measurement in the data set) were replaced by 3. Which measures of central tendency would be affected by the change? Choose all that apply.**
Options:
- Mean
- Median
- Mode
- None of these measures
**c) Suppose that, starting with the original data set, the largest measurement were removed. Which measures of central tendency would be changed from those of the original data set? Choose all that apply.**
Options:
- Mean
- Median
- Mode
- None of these measures
**d) The relative values of the mean and median for the original data set are typical of data that have a significant skew to the right. What are the relative values of the mean and median for the original data set? Choose only one.**
Options:
- Mean is greater
- Median is greater
- Cannot be determined
**Additional Instruction:**
- Press "Check" to verify your answers.
- Use the "Explanation" for detailed information on each question.

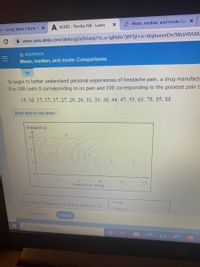
Transcribed Image Text:**Title: Understanding Headache Pain Ratings Using Statistics**
In this educational module, we explore the application of statistical measures—mean, median, and mode—to understand personal experiences of headache pain. A study was conducted by a drug manufacturer to assess headache severity on a scale from 0 to 100, where 0 indicates no pain and 100 indicates extreme pain.
**Data Collected:**
The headache ratings collected are as follows:
15, 16, 17, 17, 17, 29, 29, 31, 33, 38, 44, 47, 55, 63, 78, 85, 88
**Graphical Representation:**
The graph displayed is a frequency distribution of the headache ratings. The x-axis represents the headache rating scale from 0 to 100, while the y-axis indicates the frequency of each rating:
- Ratings 0-50 show a slight increase in frequency, with a noticeable peak around the rating of 17.
- Frequency decreases again after the rating of 47.
- The graph suggests that most data points are concentrated between ratings 15 to 47.
**Statistical Measures:**
- **Mean:** The average of all headache ratings.
- **Median:** The middle value when all ratings are arranged in order.
- **Mode:** The most frequently occurring rating.
**Questions for Consideration:**
(a) Which measures of central tendency (mean, median, mode) are appropriate for this dataset? Select all that apply.
This analysis will help in better understanding statistical concepts and how they can be used to interpret real-world data, such as patient experiences with headache severity.
Expert Solution
This question has been solved!
Explore an expertly crafted, step-by-step solution for a thorough understanding of key concepts.
This is a popular solution
Trending nowThis is a popular solution!
Step by stepSolved in 4 steps with 3 images

Knowledge Booster
Similar questions
- Serial Killers: Everything Up to One-Way Between-Groups ANOVA What analysis could be used to see if there are significant differences in the mean numbers of victims of serial killers in Austrailia, Canada, the United States, and the United Kingdom? one-way between-groups ANOVA In which of the following four categories does this situation fall? a. only scale variables b. nominal independent variables, scale dependent variable c. only nominal variables d. any ordinal variables (that cannot be treated as nominal)arrow_forwardWhat is the preferred measure of central tendency for scores measured on an ordinal scale? Question 11 options: The mean The median The mode Central tendency cannot be determine for ordinal dataarrow_forwardThe statistical procedure that calculates a linear relationship between two interval/ratio variables is known as _______.arrow_forward
- Serial Killers: Everything Up to One-Way Between-Groups ANOVA What analysis could be used to see if there are significant differences in the mean numbers of victims of serial killers in Austrailia, Canada, the United States, and the United Kingdom? one-way between-groups ANOVA In which of the following four categories does this situation fall? nominal independent variables, scale dependent variable How many nominal independent variables are there? a. one nominal variable b. two nominal variablesarrow_forwardUse the proper methodarrow_forwardWhat is the slope of the median median line for the dataset in this table?arrow_forward
- The histogram below shows the ages (in years) of Honda Civic automobiles listed for sale on the Seattle Times Web site on November 26, 2003. 20 15 10 2 4 6 8 10 12 14 16 18 Age (years) Which of the following terms apply to this histogram? (Select all that apply.) O negatively skewed(to the left) O uniform O symmetric O bimodal O unimodal O positively skewed(to the right) Which measure of center is most appropriate for this data? O median O mean Which measure of spread is most appropriate for this data? O standard deviation M # of carsarrow_forwardAvailable below are amounts of arsenic in samples of brown rice from three different regions. The amounts are in micrograms of arsenic and all samples have the same serving size. Use a 0.05significance level to test the claim that the three samples are from populations with the same mean. Do the amounts of arsenic appear to be different in the different regions? Given that the amounts of arsenic in the samples from region Ahave the highest mean, can we conclude that brown rice from region A poses the greatest health problem? Arsenic Amounts (micrograms) A 5.8 5.8 6.5 6.5 6.9 7.2 7.3 7.3 7.6 7.6 7.9 7.9 B 4.5 4.9 5.2 5.2 5.5 5.8 5.8 5.9 6.3 6.3 6.4 6.4 C 1.8 3.7 4.1 4.1 4.6 4.6 4.8 5.1 5.2 5.6 5.7 5.7 The Test statistic is: The P-value is: The conclusion is:arrow_forward
arrow_back_ios
arrow_forward_ios
Recommended textbooks for you
 A First Course in Probability (10th Edition)ProbabilityISBN:9780134753119Author:Sheldon RossPublisher:PEARSON

A First Course in Probability (10th Edition)
Probability
ISBN:9780134753119
Author:Sheldon Ross
Publisher:PEARSON
