
MATLAB: An Introduction with Applications
6th Edition
ISBN: 9781119256830
Author: Amos Gilat
Publisher: John Wiley & Sons Inc
expand_more
expand_more
format_list_bulleted
Related questions
Question
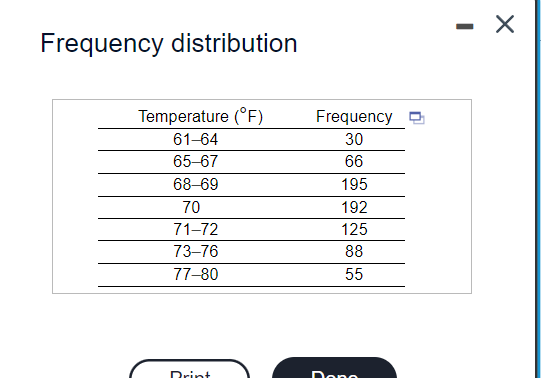

Transcribed Image Text:Frequency distribution
Temperature (°F)
Frequency O
61-64
30
65-67
66
68-69
195
70
192
71–72
125
73–76
88
77-80
55
Drint
Dono

Transcribed Image Text:Often, frequency distributions are reported using unequal class widths because the frequencies of some groups would otherwise be small or very large. Consider the
following data, which represent the daytime household temperature the thermostat is set to when someone is home for a random sample of 751 households.
Determine the class midpoint, if necessary, for each class and approximate the mean and standard deviation temperature.
E Click the icon to view the frequency distribution for the daytime household temperature.
Class
Class Midpoint
61-64
65-67
68-69
70
71-72
73–76
77-80
(Round to one decimal place as needed.)
Expert Solution
This question has been solved!
Explore an expertly crafted, step-by-step solution for a thorough understanding of key concepts.

This is a popular solution

Trending nowThis is a popular solution!

Step by stepSolved in 2 steps with 2 images

Knowledge Booster

Similar questions
- Use the Histogram tool to develop a frequency distribution and histogram for the number of months as a customer of the bank in the data below. Compute the relative and cumulative relative frequencies and use a line chart to construct an ogive. Complete the frequency distribution for the months as a customer, and compute the relative and cumulative relative frequencies. (Type integers or decimals rounded to three decimal places as needed.) Bins Frequency Relative Frequency Cumulative Relative Frequency 10 enter your response here enter your response here enter your response here 20 enter your response here enter your response here enter your response here 30 enter your response here enter your response here enter your response here 40 enter your response here enter your response here enter your response here 50 enter your response here enter your response here enter your…arrow_forwardConstruct a frequency distribution for the data using five classes. Describe the shape of the distribution. The ages of dishwashers (in years) in 20 randomly selected households are shown below. 9 13 5 15 12 6 4 9 11 1 7 898 7 6 8 8 21 OA. bell shaped OB. skewed to the left OC. skewed to the right O D. uniformarrow_forwardMichael is taking a self-paced math class. His scores for each of the 20 quizzes during the academicyear are shown below.Quiz scores: 80 71 88 85 7789 73 87 87 8685 75 72 84 8973 81 68 86 75a. Construct a frequency distribution for the grouped data using the following classes withwidth 6:66 to 71 72 to 77 78 to 83 84 to 89b. Calculate the relative frequency for each class.arrow_forward
- A researcher who studies mental health is interested in the length of time (in days) that a patient stays in the hospital after they have presented to emergency having suicidal ideation. The researcher follows the first 30 patients during the month of January and follows them until each one of them is released. Below is the histogram of the data obtained from the 30 patients. 1. What is the shape of this distribution and please construct a frequency table. Given the shape and type of data, which measure of central tendency would you be more likely to report? Why?arrow_forwardIdentify the lower class limits, upper class limits, class width, class midpoints, and class boundaries for the given frequency distribution. Also identify the number of individuals included in the summary.complete a-f a. Identify the lower class limits. b. Identify the upper class limits. c. Identify the class width. d. Identify the class midpoints. e. Identify the class boundaries. f. Identify the number of individuals included in the summary.arrow_forwardA chemical technician measured the temperatures (in °C) of 17 different solutions. The temperatures are shown below. Complete the grouped relative frequency distribution for the data. (Note that we are using a class width of 5.) Write each relative frequency as a decimal rounded to the nearest, hundredth, not as a percentage. Temperature Temperature Relative (in °C) (in °C) frequency 98 to 102 105 102 117 98 110 103 to 107 105 108 111 114 103 108 to 112 110 112 106 108 104 113 to 117 100 108 Continue O2021 McGraw Hill LLC. All Rights Reserved. Ter para buscararrow_forward
- To display the distribution of grades (A, B, C, D, F) in a course, it would be correct to use which of the following? A histogram A stemplot A bar chart A quantitative pie chart A time plotarrow_forwardungrouped or grouped for eacharrow_forwardA chemical technician measured the temperatures (in C) of 18 different solutions. The temperatures are shown below. Complete the grouped relative frequency distribution for the data. (Note that we are using a class width of 6.) Write each relative frequency as a decimal rounded to the nearest hundredth, not as a percentage. Temperature (in °C) Temperature Relative (in °C) frequency 95 to 100 116 100 108 114 104 101 to 106 109 104 115 95 107 107 to 112 117 112 103 110 118 113 to 118 113 66 96arrow_forward
arrow_back_ios
arrow_forward_ios
Recommended textbooks for you
- MATLAB: An Introduction with ApplicationsStatisticsISBN:9781119256830Author:Amos GilatPublisher:John Wiley & Sons Inc
 Probability and Statistics for Engineering and th...StatisticsISBN:9781305251809Author:Jay L. DevorePublisher:Cengage Learning
 Statistics for The Behavioral Sciences (MindTap C...StatisticsISBN:9781305504912Author:Frederick J Gravetter, Larry B. WallnauPublisher:Cengage Learning
  Elementary Statistics: Picturing the World (7th E...StatisticsISBN:9780134683416Author:Ron Larson, Betsy FarberPublisher:PEARSON
 The Basic Practice of StatisticsStatisticsISBN:9781319042578Author:David S. Moore, William I. Notz, Michael A. FlignerPublisher:W. H. Freeman
 Introduction to the Practice of StatisticsStatisticsISBN:9781319013387Author:David S. Moore, George P. McCabe, Bruce A. CraigPublisher:W. H. Freeman
MATLAB: An Introduction with Applications
Statistics
ISBN:9781119256830
Author:Amos Gilat
Publisher:John Wiley & Sons Inc
Probability and Statistics for Engineering and th...
Statistics
ISBN:9781305251809
Author:Jay L. Devore
Publisher:Cengage Learning
Statistics for The Behavioral Sciences (MindTap C...
Statistics
ISBN:9781305504912
Author:Frederick J Gravetter, Larry B. Wallnau
Publisher:Cengage Learning
Elementary Statistics: Picturing the World (7th E...
Statistics
ISBN:9780134683416
Author:Ron Larson, Betsy Farber
Publisher:PEARSON
The Basic Practice of Statistics
Statistics
ISBN:9781319042578
Author:David S. Moore, William I. Notz, Michael A. Fligner
Publisher:W. H. Freeman
Introduction to the Practice of Statistics
Statistics
ISBN:9781319013387
Author:David S. Moore, George P. McCabe, Bruce A. Craig
Publisher:W. H. Freeman