MATLAB: An Introduction with Applications
6th Edition
ISBN: 9781119256830
Author: Amos Gilat
Publisher: John Wiley & Sons Inc
expand_more
expand_more
format_list_bulleted
Question

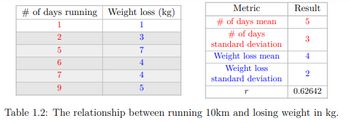
Transcribed Image Text:Find the equation of the least-squares regression line for the data found in Table 1.2. Lastly,
are we able to find a line that outputs a smaller total of the sum of the residuals squared
than the least-squares regression line, why or why not?

Transcribed Image Text:# of days running Weight loss (kg)
1
1
3
2
5
6
7
9
7
4
4
5
Metric
# of days mean
# of days
standard deviation
Weight loss mean
Weight loss
standard deviation
T
Result
5
3
4
2
0.62642
Table 1.2: The relationship between running 10km and losing weight in kg.
Expert Solution
arrow_forward
Step 1: Determine the given information
The given paired observations of "days of running" and the "weight loss amount (in kg)" are:
| # of days running | Weight loss (kg) |
| 1 | 1 |
| 2 | 3 |
| 5 | 7 |
| 6 | 4 |
| 7 | 4 |
| 9 | 5 |
The summarized data is given as:
| Metric | Result |
| # of days mean | 5 |
| # of days standard deviation | 3 |
| Weight loss mean | 4 |
| Weight loss standard deviation | 2 |
| 0.62642 |
The objective is to obtain the regression equation.
Considering the "amount of weight loss" (in kg) (say
Step by stepSolved in 3 steps with 1 images

Knowledge Booster
Similar questions
- Testing:H0:μ=38.5H1:μ<38.5Your sample consists of 35 subjects, with a mean of 38.3 and a standard deviation of 1.93.Calculate the test statistic, rounded to 2 decimal places. t =arrow_forwardHello, I need a little help trying to figure out how to get the Deviation from Mean and calculations. I would appreciate any assistance so that I can understand the lab.arrow_forwardYou review your data from a population A and population B. The mean and standard deviation are noted as N(mean, standard deviation). NA(400,10) and NB(300,25). 95 percent of the observations for population A exceed a value of___________?95 percent of the observations for population B are less than a value of _____________?arrow_forward
- Please find Percentile rankingarrow_forwardIQ tests supposedly measure our intelligence. They typically are ‘normed’ so that they have a mean of 100 and a standard deviation of 15. (Higher scores show higher intelligence.) Use the graph and use the z-score and percents from columns b and c in Table A, when relevant. If you scored 132, what is your z-score? (Interpret.) Use table A X, z(a), (b), and (c) X z (a) (b) (c) and use the graph! Write down or save your response to use in Part 2 of this quiz. Group of answer choices -2.53 z. I'm at the 98.34 percentile rank and 1.66% of people scored smarter than me. 2.13 z. I'm at the 98.34 percentile rank and 1.66% of people scored smarter than me. -2.13 z. I'm at the 1.66 percentile rank and 98.34% of people scored smarter than me. 2.53 z. I'm at the 0.57 percentile rank and 99.43% of people scored smarter than me. 2.13 z. I'm at the 1.66 percentile rank and 98.34% of people scored smarter than me. 2.53 z. I'm at the 99.43 percentile rank…arrow_forward
arrow_back_ios
arrow_forward_ios
Recommended textbooks for you
 MATLAB: An Introduction with ApplicationsStatisticsISBN:9781119256830Author:Amos GilatPublisher:John Wiley & Sons Inc
 Probability and Statistics for Engineering and th...StatisticsISBN:9781305251809Author:Jay L. DevorePublisher:Cengage Learning
 Statistics for The Behavioral Sciences (MindTap C...StatisticsISBN:9781305504912Author:Frederick J Gravetter, Larry B. WallnauPublisher:Cengage Learning
 Elementary Statistics: Picturing the World (7th E...StatisticsISBN:9780134683416Author:Ron Larson, Betsy FarberPublisher:PEARSON
 The Basic Practice of StatisticsStatisticsISBN:9781319042578Author:David S. Moore, William I. Notz, Michael A. FlignerPublisher:W. H. Freeman
 Introduction to the Practice of StatisticsStatisticsISBN:9781319013387Author:David S. Moore, George P. McCabe, Bruce A. CraigPublisher:W. H. Freeman

MATLAB: An Introduction with Applications
Statistics
ISBN:9781119256830
Author:Amos Gilat
Publisher:John Wiley & Sons Inc

Probability and Statistics for Engineering and th...
Statistics
ISBN:9781305251809
Author:Jay L. Devore
Publisher:Cengage Learning

Statistics for The Behavioral Sciences (MindTap C...
Statistics
ISBN:9781305504912
Author:Frederick J Gravetter, Larry B. Wallnau
Publisher:Cengage Learning

Elementary Statistics: Picturing the World (7th E...
Statistics
ISBN:9780134683416
Author:Ron Larson, Betsy Farber
Publisher:PEARSON

The Basic Practice of Statistics
Statistics
ISBN:9781319042578
Author:David S. Moore, William I. Notz, Michael A. Fligner
Publisher:W. H. Freeman

Introduction to the Practice of Statistics
Statistics
ISBN:9781319013387
Author:David S. Moore, George P. McCabe, Bruce A. Craig
Publisher:W. H. Freeman