FINANCIAL ACCOUNTING
10th Edition
ISBN: 9781259964947
Author: Libby
Publisher: MCG
expand_more
expand_more
format_list_bulleted
Question
thumb_up100%
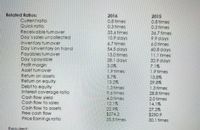
Starbucks is today the world’s leading roaster and retailer of specialty coffee. The company purchases and roasts whole coffee beans and sells them, along with a variety of freshly brewed coffees and other beverages, food items, and coffee-related merchandise, in its retail shops. It also produces and sells bottled coffee drinks, a line of premium ice creams, and most recently, instant coffee products. Starbucks is one of the most recognized and respected brands in the world.
Required:
Evaluate the company’s performance in terms of Adequacy of

Transcribed Image Text:2016
0.8 times
0.3 times
33.6 times
10.9 days
6.7 times
54.5 days
13.0 times
28.1 ooys
3.0%
1.9times
5.7%
13.2%
1.3times
9.6times
4.0times
12.1%
2015
0.8times
0.3 times
36.7 times
9.9 days
6.0 times
60.8 days
11.1 times
32.9 days
7.1%
1.9 times
Related Ratios:
Curentratio
Quick ratio
Receivable turnover
Day'ssales uncolected
Inventory tumover
Day'sinventory on hand
Payablesturnover
Day'spayable
Profit margin
Asset turnover
Return on assets
Return on equity
Debtto equity
Interest coverage ratio
Cash flow yield
Cash flow to sales
Cash flow to assets
Free cash flow
Price Earnings ratio
13.8%
29.8%
1.3times
28.8times
2.0 times
14.1%
27.2%
$250.9
30.1 times
చర చెలె
$274.2
35.5times
Required:

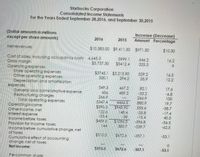
Transcribed Image Text:Starbucks Corporation
Consolidated Income Statements
For the Years Ended September 28,2016, and September 30,2015
(Dollar amounts in millions
except per share amounts)
Increase (Decrease)
Amount Percentage
2016
2015
Netrevenues
$10.383.00 $9.411.50 $971.50
$10.30
Cost of sales, including occupancy costs 4.645.3
Gross morgin
Operating expenses
Store operating expenses
Other operating expenses
Depreciation and amortization
expenses
General andadministrative expense
Restructuring charges
Total operating expenses
Operatingincome
Otherincome. net
interest expense
Income before taxes
Provision for income taxes
Income before cumulative change, net
of taxes
Cumulative effect of accounting
change, net of taxes
Net income
3999.1
$5412.4
646.2
325.3
16.2
$5.737.30
$3745.1 $3.215.90
330.1
529.2
35.9
16.5
12.2
294.2
549.3
456
266.9
5347.4
$390.3
122.6
-53.4
$459.5
467.2
489.2
82.1
-33.2
266.9
880.9
555.6
-25.8
-15.4
-596.8
-239.7
17.6
-6.8
100
19.7
-58.7
-17.4
40.5
4466.5
$945.90
148.4
+38
ST056 3
383.7
-56.5
44
-62.5
$315.5
$672.6
-357.1
-53.1
$315.5
$672.6
-357.1
-53.1
Percommon share:
Expert Solution
This question has been solved!
Explore an expertly crafted, step-by-step solution for a thorough understanding of key concepts.
Step by stepSolved in 2 steps

Knowledge Booster
Learn more about
Need a deep-dive on the concept behind this application? Look no further. Learn more about this topic, accounting and related others by exploring similar questions and additional content below.Similar questions
- Nonearrow_forwardPeet's Coffee and Teas produces some flavorful varieties of Peet's brand coffee. Is Peet's a monopoly? O No, Peet's is not a monopoly because there are many branches of Peet's. O No, although Peet's coffee is a unique product, there are many different brands of coffee that are very close substitutes. Yes, there are no substitutes to Peet's coffee. O Yes, Peet's is the only supplier of Peet's coffee in a market where there are high barriers to entry.arrow_forwardStarbucks is today the world’s leading roaster and retailer of specialty coffee. The company purchases and roasts whole coffee beans and sells them, along with a variety of freshly brewed coffees and other beverages, food items, and coffee-related merchandise, in its retail shops. It also produces and sells bottled coffee drinks, a line of premium ice creams, and most recently, instant coffee products. Starbucks is one of the most recognized and respected brands in the world. Required: Evaluate the company’s performance in terms of Liquidityarrow_forward
- Blue Apron IPO Leaves a Bad Taste Founded in 2012, Blue Apron is one of the top meal-kit delivery services doing business in the United States. Started by three co-founders—Matt Salzberg, Matt Wadiak, and Ilia Pappas—Blue Apron provides pre-portioned ingredients (and recipes) for a meal, delivered to consumers’ front doors. According to recent research, the U.S. meal-kit delivery industry is an $800 million business with the potential to scale up quickly, as more and more consumers struggle to find time to go grocery shopping, make meals, and spend time with family and friends in their hectic daily lives. As word spread among foodies about the quality and innovative meals put together by Blue Apron, the company’s popularity took off, supported by millions in start-up funding. Costs to scale the business have not been cheap—estimates suggest that Blue Apron’s marketing costs have been high. Despite the challenges, by early 2017 the company was selling more than 8 million meal kits a…arrow_forwardUse the following information for Exercises 10 through 12: Babcock Company manufactures fast-baking ovens in the United States at a production cost of $500 per unit and sells them to uncontrolled distributors in the United States and a wholly-owned sales subsidiary in Canada. Babcock's U.S. distributors sell the ovens to restaurants at a price of $1,000, and its Canadian subsidiary sells the ovens at a price of $1,100. Other distributors of ovens to restaurants in Canada normally earn a gross profit equal to 25 percent of selling price. Babcock's main competitor in the United States sells fast-baking ovens at an average 50 percent markup on cost. Babcock's Canadian sales subsidiary incurs operating costs, other than cost of goods sold, that average $250 per oven sold. The average operating profit margin earned by Canadian distributors of fast-baking ovens is 5 percent.arrow_forwardNGD Corp, a publically traded company, is a manufacturer of electrical supplies. Its main headquarters is based in Salt Lake City, Utah, and the company has been operating since 1977. The company sells its products to the retail market on a world-wide basis. Its major clientele is Home Depot and Lowes and has captured about 10 percent of the world market of light bulbs sales. Their financial statements presented below, for the Year Ending December 31, 2019, have been prepared using US GAAP. The controller would like to begin to see the effects of using IFRS on the Income Statement and Balance Sheet and you has been assigned to help with this task. The company would like to adapt IFRS by as early as next year as it is considering a new stock issue in the London Stock Exchange, which requires IFRS compliance. ADDITIONAL INFORMATION 1. NGD Corp. uses the LIFO method to account for its inventory. The LIFO reserve was $30,000 at the beginning of the year and $40,000 as of year-end. 2.…arrow_forward
- Renner Coffee Beans Inc. produces two coffee bean products: "Specialty" and "House." The "House" product is sold to a few major vendors in bulk. The "Specialty product is sold direct to individual consumers. The "Specialty" product includes a designer box in which the beans are hand packed into a red velvet drawstring bag, A leaflet with dessert recipes is also included. The "House" product simply packages the beans into a basic coffee bag. Renner lec, currently uses a plant-wide rate to allocate overhead costs based on direct labor hours, Overhead is estimated to be $460,000 for the year, while direct labor hours are estimated to be 80,000, The Specialty" product requires $5 in direct materials per unit and I direct labor hour. A total of 20,000 units of the "Specialty" product were manufactured during the year. The "House" product requires $1.50 in direct materials per unit and .5 direct labor hours. 120,000 units of the "House" product were produced during the year. The direct labor…arrow_forwardABC Ltd manufactures a range of frozen convenience meals. The company operates production plants globally and partners with thousands of farmers and growers around the world. It packages, stores and transports its own products, and their products are consumed by millions of customers every day. The company, along with its partnering farmers and growers, have been under increasing pressure to adapt to climate change and mitigate environmental impacts. There has been an increase in water usage across the years and some of the growing regions experienced severe drought. Further, changes in social demand have resulted in increased interest on food safety and quality and sustainable packaging. The production manager of ABC Ltd wants funding for a new and more energy-efficient machine. The machine has a purchase price of $2,300,000, an estimated useful life of four years and no residual value. Projected operating data that shows the incremental revenue and costs for the first year is as…arrow_forwardHarrogate Chocolate Ltd is a limited company incorporated under the United Kingdom’s (UK) law. The company is established in Harrogate and is resident in the UK. Harrogate Chocolate Ltd trades in hand made, vegan, sugar free chocolates and hot chocolates. Harrogate Chocolate Ltd is different from the other companies established in the market across the UK. Therefore, they use the finest chocolates that they buy from the parent company BelManches Chocolate Plc. Harrogate Chocolate Ltd commenced trading on the 1 of October 2022 and the company prepared its first accounts for the six-month period ending 31 March 2023. Paul William is the financial controller, and he prepared the following information: 1 - Trading profit The tax adjusted trading profit based on the draft accounts for the six-month period ended 31 March 2022 is £368,400. This figure is before making any adjustments required for: • Director’s remuneration of £23,000 paid to the managing director of Harrogate Chocolate ltd.…arrow_forward
arrow_back_ios
arrow_forward_ios
Recommended textbooks for you

 AccountingAccountingISBN:9781337272094Author:WARREN, Carl S., Reeve, James M., Duchac, Jonathan E.Publisher:Cengage Learning,
 Accounting Information SystemsAccountingISBN:9781337619202Author:Hall, James A.Publisher:Cengage Learning,
 Horngren's Cost Accounting: A Managerial Emphasis...AccountingISBN:9780134475585Author:Srikant M. Datar, Madhav V. RajanPublisher:PEARSON
 Intermediate AccountingAccountingISBN:9781259722660Author:J. David Spiceland, Mark W. Nelson, Wayne M ThomasPublisher:McGraw-Hill Education
 Financial and Managerial AccountingAccountingISBN:9781259726705Author:John J Wild, Ken W. Shaw, Barbara Chiappetta Fundamental Accounting PrinciplesPublisher:McGraw-Hill Education


Accounting
Accounting
ISBN:9781337272094
Author:WARREN, Carl S., Reeve, James M., Duchac, Jonathan E.
Publisher:Cengage Learning,

Accounting Information Systems
Accounting
ISBN:9781337619202
Author:Hall, James A.
Publisher:Cengage Learning,

Horngren's Cost Accounting: A Managerial Emphasis...
Accounting
ISBN:9780134475585
Author:Srikant M. Datar, Madhav V. Rajan
Publisher:PEARSON

Intermediate Accounting
Accounting
ISBN:9781259722660
Author:J. David Spiceland, Mark W. Nelson, Wayne M Thomas
Publisher:McGraw-Hill Education

Financial and Managerial Accounting
Accounting
ISBN:9781259726705
Author:John J Wild, Ken W. Shaw, Barbara Chiappetta Fundamental Accounting Principles
Publisher:McGraw-Hill Education