MATLAB: An Introduction with Applications
6th Edition
ISBN: 9781119256830
Author: Amos Gilat
Publisher: John Wiley & Sons Inc
expand_more
expand_more
format_list_bulleted
Concept explainers
Topic Video
Question
thumb_up100%

Transcribed Image Text:nts X
O (135) X
S Hints X
9 Hints X
D (135) x O (135) X
O (135) X
D (135) X
D (135) X
showtest.php?action=skip&to=10&reattempt=D10
*引(G
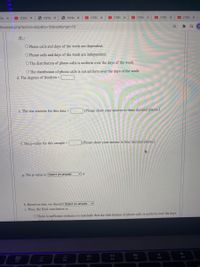
H1:
O Phone calls and days of the week are dependent.
O Phone calls and days of the week are independent.
O The distribution of phone calls is uniform over the days of the week.
O The distribution of phone calls is not uniform over the days of the week.
d. The degrees of freedom =
e. The test-statistic for this data =
(Please show your answer to three decimal places.)
f. The p-value for this sample :
(Please show your answer to four decimal places.)
a
g. The p-value is Select an answer
h. Based on this, we should Select an answer
i. Thus, the final conclusion is...
O There is sufficient evidence to conclude that the distribution of phone calls is uniform over the days
DD
F11
000
000
F10
F8
F9
F6
F7
F4
F5

Transcribed Image Text:B Hints x
D (135) X
O Hints x
O Hints x
D (135) x
(135) x
D (135)
D (135) X
D (135) X
ent/showtest.php?action=skip&to=10&reattempt3D10
* ES
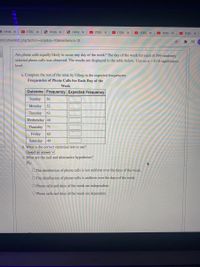
Are phone calls equally likely to occur any day of the week? The day of the week for each of 399 randomly
selected phone calls was observed. The results are displayed in the table below. Use an a = 0.10 significance
level.
a. Complete the rest of the table by filling in the expected frequencies:
Frequencies of Phone Calls for Each Day of the
Week
Outcome Frequency Expected Frequency
Sunday
56
Monday
52
Tuesday
63
Wednesday 46
Thursday
71
Friday
62
Saturday
49
b. What is the correct statistical test to use?
Select an answer v
c. What are the null and alternative hypotheses?
Но:
O The distribution of phone calls is not uniform over the days of the week.
O The distribution of phone calls is uniform over the days of the week.
O Phone calls and days of the week are independent.
O Phone calls and days of the week are dependent.
Expert Solution
arrow_forward
Working
a)
| Freuency (O) | Expected E | (O-E)^2 | (O-E)^2/E |
| 56 | 57 | 1 | 0.017544 |
| 52 | 57 | 25 | 0.438596 |
| 63 | 57 | 36 | 0.631579 |
| 46 | 57 | 121 | 2.122807 |
| 71 | 57 | 196 | 3.438596 |
| 62 | 57 | 25 | 0.438596 |
| 49 | 57 | 64 | 1.122807 |
Step by stepSolved in 2 steps with 2 images

Knowledge Booster
Learn more about
Need a deep-dive on the concept behind this application? Look no further. Learn more about this topic, statistics and related others by exploring similar questions and additional content below.Similar questions
- Subject : Statisticsarrow_forwardThe following statistics represent weekly salaries at a construction company. $660 First quartile $485 $560 $635 Third quartile 95th percentile $834 $595 Mean Median Mode The percent of employees' salaries that surpassed $834 is = O Search # w an example Get more help. A %. √√√ 1, (0,0 Clear aarrow_forwardClass 2 Class 1 30 Grades of Two Classes + 40 50 60 + 70 80 90 100 110 120 Grade The box plots above show the grades of two classes. Use these box plots to answer the following questions: 1. What is the IQR of Class 1? 2. What is the range of Class 2?arrow_forward
- hw 14 Here is a set of data. 58 64 101 108 133 210 244 248 261 356 404 611 828 880 907 920 931 939 Identify the 5 number summary (min, Q1, median, Q3, max) , , , ,arrow_forwardSmall Sample Size The dataset imagpop contains information about 10000 people from an imaginary population. One of the variables is math, which indicates whether the individual was a mathematics major. You can see the distribution of math majors in the population in the row percents shown below: rowPerc(xtabs(~math,data=imagpop)) ## no yes Total## 95.37 4.63 100.00 Suppose you were interested in the following Research Question: Are quantitative skills an important part of your job? You decide to quickly take a simple random sample of size 10 from this population. You can see the distribution of math majors in the sample below: set.seed(2014)smallsamp<-popsamp(n=10,pop=imagpop)rowPerc(xtabs(~math,data=smallsamp)) ## no yes Total## 100 0 100 Which of the following statements best describes a problem that may arise in this scenario? Group of answer choices ( ) The sampled individuals that were selected might all have jobs that require quantitative skills. This…arrow_forwardA rancher is interested in the average age that a cow begins producing milk. Match the vocabulary word with its corresponding example. The average age for the 62 observed milk cows as they first produced milk The average age that all milk cows are when they first produce milk The list of the 62 ages The 62 milk cows that were observed by the rancher All milk cows The age when a milk cow first produced milk a. Sample b. Data c. Variable d. Statistic e. Parameter f. Populationarrow_forward
- Step by step I need solving solution of part C and D F pleasearrow_forwardDirections: A certain type of bolt must fit through a 20 millimeter test hole or else it is discarded. If the diameters of the bolts are normally distributed, with µ = 18.2 millimeters u and σ = 0.8 millimeters, what percentage of the bolts will be o discarded. Percentage = %arrow_forwardCHATTIN LESSON 24 SESSION 2 Develop Comparing Centers of Data Relative to Variability > Read and try to solve the problem below. The box plots below compare the high temperatures in two cities in June and in October. Are the high temperatures in the two cities more similar in June or in October? Show how you know. City A October June City A ⚫ City A City B⚫ City B H + ||| 66 74 78 70 82 86 High Temperature (°F) 46 50 54 58 62 High Temperature (°F) 66 TRY IT Math Toolkit grid paper, number lines City Barrow_forward
arrow_back_ios
arrow_forward_ios
Recommended textbooks for you
 MATLAB: An Introduction with ApplicationsStatisticsISBN:9781119256830Author:Amos GilatPublisher:John Wiley & Sons Inc
 Probability and Statistics for Engineering and th...StatisticsISBN:9781305251809Author:Jay L. DevorePublisher:Cengage Learning
 Statistics for The Behavioral Sciences (MindTap C...StatisticsISBN:9781305504912Author:Frederick J Gravetter, Larry B. WallnauPublisher:Cengage Learning
 Elementary Statistics: Picturing the World (7th E...StatisticsISBN:9780134683416Author:Ron Larson, Betsy FarberPublisher:PEARSON
 The Basic Practice of StatisticsStatisticsISBN:9781319042578Author:David S. Moore, William I. Notz, Michael A. FlignerPublisher:W. H. Freeman
 Introduction to the Practice of StatisticsStatisticsISBN:9781319013387Author:David S. Moore, George P. McCabe, Bruce A. CraigPublisher:W. H. Freeman

MATLAB: An Introduction with Applications
Statistics
ISBN:9781119256830
Author:Amos Gilat
Publisher:John Wiley & Sons Inc

Probability and Statistics for Engineering and th...
Statistics
ISBN:9781305251809
Author:Jay L. Devore
Publisher:Cengage Learning

Statistics for The Behavioral Sciences (MindTap C...
Statistics
ISBN:9781305504912
Author:Frederick J Gravetter, Larry B. Wallnau
Publisher:Cengage Learning

Elementary Statistics: Picturing the World (7th E...
Statistics
ISBN:9780134683416
Author:Ron Larson, Betsy Farber
Publisher:PEARSON

The Basic Practice of Statistics
Statistics
ISBN:9781319042578
Author:David S. Moore, William I. Notz, Michael A. Fligner
Publisher:W. H. Freeman

Introduction to the Practice of Statistics
Statistics
ISBN:9781319013387
Author:David S. Moore, George P. McCabe, Bruce A. Craig
Publisher:W. H. Freeman