
ENGR.ECONOMIC ANALYSIS
14th Edition
ISBN: 9780190931919
Author: NEWNAN
Publisher: Oxford University Press
expand_more
expand_more
format_list_bulleted
Related questions
Question
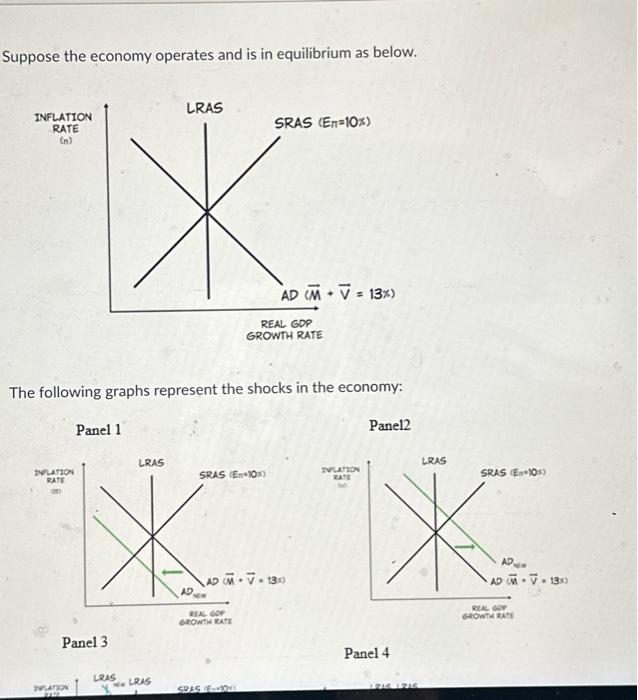

Transcribed Image Text:Suppose the economy operates and is in equilibrium as below.
INFLATION
RATE
(по
INFLATION
RATE
an
LRAS
X
ELATION
ww
The following graphs represent the shocks in the economy:
Panel 1
Panel 3.
LRAS
ж
1ELRAS
AD
SRAS (En-10)
SRAS (En-10%)
RIAL GO
GROWTH RATE
AD M + V = 13x)
REAL GDP
GROWTH RATE
SPAS E-100
NAP M - V = 13:1).
KA
INPLATION
RATE
Panel2
LRAS
Ж
Panel 4
SRAS (En-10%)
AV-13
REAL GOT
GROWTH RATE

Transcribed Image Text:INFLATION
RATE
S
Panel 1
Panel 3
INFLATION
RATE
Panel 2
Panel 1
LRAS
Panel 3
LRAS
Panel 4
AD
SRAS (E10)
NEW
LRAS
X₂
AD
AD (M.V.13%)
REAL GOP
GROWTH RATE
SRAS (-10)
ADMV13)
REAL GOP
GROWTH RATE
ILATION
RATE
ENFLATION
RATE
Panel2
Panel 4
LRAS RAS
LRAS
SRAS (En-10x)
SRAS (E10)
A.V.
REAL GOP
GROWTH RATE
Which graph/Panel best illustrates what happens if consumers and investors become more
optimistic?
REAL GOP
GROWTH RATE
AD
AD (M-V13)
Expert Solution
This question has been solved!
Explore an expertly crafted, step-by-step solution for a thorough understanding of key concepts.

Step by stepSolved in 3 steps

Knowledge Booster


Learn more about
Need a deep-dive on the concept behind this application? Look no further. Learn more about this topic, economics and related others by exploring similar questions and additional content below.Similar questions
- Note:- Do not provide handwritten solution. Maintain accuracy and quality in your answer. Take care of plagiarism. Answer completely. You will get up vote for sure.arrow_forwardCalculate gross and net economic growth rate between $10 trillion to $15 trillion economies with 4% inflation.arrow_forwardUnited Kingdom Kenya Price per Value of Value of unit (GBP) output Оuаntity Price per Quantity unit (KSh) output (GBP) (KSh) 5000 per 75 650,000 Equipment (millions of 500 unit units) Food 500 10 per kg 125 750 (millions of kg) Total GDP (local currency) a. If equipment is fully tradable, so that the price in Kenyan shillings (KSh) equals the price in pounds times the market exchange rate, what is the market exchange rate? b. Based on its relative price, does it appear that food is tradable? Is it more or less expensive in Kenya, compared to the UK? c. Fill in the table above (ignoring cells with "-"). What is the UK's total GDP in GBP? What is Kenya's total GDP in KSh? d. What is Kenya's GDP in GBP at market exchange rates? e. Following the calculations on pp 28-29 of ED, what is Kenya's GDP in pounds calculated by using UK prices for each individual product and applying that price to Kenya's quantities (that is, using purchasing power parity [PPP])? f. Is the value you calculated in…arrow_forward
- The Solow model is an important formal model of economic growth. Assume that the production function is Y = F(K,N) = zK° N¹-a, where 0 < a < 1. Production is constant returns to scale. We use lowercase to denote variables in per capita terms.arrow_forwardY - K"(LE) The economy has a capital share of 0.20, a saving rate of 45 percent, a depreciation rate of 3.75 percent, a rate of population growth of 5.00 percent, and a rate of labor-augmenting technological change of 3.5 percent. It is in steady state. b. Solve for capital per effective worker (k"), output per elffective worker (y"), and the marginal product of capital. k' - y* = marginal product of capital =arrow_forwardPease note quesition 1 is answered it is only attached for you to see it as it contains relevant informaition. Please answer quesition 2! Suppose that work hours in New Zombie are 200 in year 1 and productivity is $8 per hour worked. What is New Zombie’s real GDP? If work hours increase to 210 in year 2 and productivity rises to $10 per hour, what is New Zombie’s rate of economic growth? Explain why sustained long-term economic growth comes from increases in labor productivity. Why do you think the trend rate of U.S. productivity growth has increased since the earlier 1973–1995 period? The GDP of year 1 is $1,600. The GDP of year two is $2,100. The rate of economic growth is 31.25% Monetary development must be supported just when endogenous elements experience an expansion in their efficiency. Work efficiency is dictated by the gathering of human capital in an economy. The more prominent the interest in human capital arrangement, the higher is the information arrangement and…arrow_forward
- t (years since 2008) GDP (trillion dollars) 14.67 -14.81 0.25 0.5 0.75 14.84 14.55 14.38 (a) Estimate the relative growth rate (percent per year) at the first four times in the table. NOTE: Round your answers to one decimal place. Relative growth rate at 0 Relative growth rate at 0.25 % Relative growth rate at 0.5 Relative growth rate at 0.75 = (b) Economists often say an economy is in recession if the GDP decreases for two quarters in a row. Was the US in recession in 2008? because The US Choose one Choose one ▼arrow_forwardQuestion 3 Year pof cars g of g of cars pof computers computers 2018 $20.000 2000 units $400 500 units 2019 $20.000 4000 units $400 1000 units 2020 $40.000 4000 units $800 1000 units Use the above glven table and compute the real GDPand the rate of growth for each year.Is there a rise in society's well-being from 2009 to 2010? Discuss.arrow_forwardCañital stick for a country is $1600 billuon at the beginning of the year. Gross investment year is 20 billion and depreciation is 30 billion capital stock st the end og the year isarrow_forward
- help please answer in text form with proper workings and explanation for each and every part and steps with concept and introduction no AI no copy paste remember answer must be in proper format with all workingarrow_forwardIn 2018, the country of Questville had a GDP of $39000.00 and the country of Mistania had a GDP of $19500.00, which is half, or 50% of Questville's GDP. If Questville grows at the slow rate of 1% for 5 years while Mistania grows at the fast rate of 6% for 5 years, what will Mistania's GDP be as a percentage of Questville's GDP in 5 years from now? Include the % sign in your answer. Does this example illustrate the concept of convergence? OYes SONOarrow_forwardYear Nominal GDP Economic Growth Workers GDP Deflator Capital Population CPI M1 Inflation (with GDP Deflator) 2019 $22,000,000 2.10% 100 110 20,000,000 200 300 $4,000,000 1.10% 2069 $384,000,000 2.80% 150 320 60,000,000 300 1200 $40,000,000 2.90% As you might expect from the increase in nominal GDP compared to the increased in the GDP deflator, real GDP grew over these projected 50 years. Also, population growth was modest given the span of 50 years. Will all of this in mind, by how much did real GDP per person grew on average over these 50 years? Don't forget that this will be an annual growth rate. Please show your work and explain you reasoning. Note:- Do not provide handwritten solution. Maintain accuracy and quality in your answer. Take care of plagiarism. Answer completely. You will get up vote for sure.arrow_forward
arrow_back_ios
SEE MORE QUESTIONS
arrow_forward_ios
Recommended textbooks for you
 Principles of Economics (12th Edition)EconomicsISBN:9780134078779Author:Karl E. Case, Ray C. Fair, Sharon E. OsterPublisher:PEARSON
 Engineering Economy (17th Edition)EconomicsISBN:9780134870069Author:William G. Sullivan, Elin M. Wicks, C. Patrick KoellingPublisher:PEARSON
 Principles of Economics (MindTap Course List)EconomicsISBN:9781305585126Author:N. Gregory MankiwPublisher:Cengage Learning
 Managerial Economics: A Problem Solving ApproachEconomicsISBN:9781337106665Author:Luke M. Froeb, Brian T. McCann, Michael R. Ward, Mike ShorPublisher:Cengage Learning
 Managerial Economics & Business Strategy (Mcgraw-...EconomicsISBN:9781259290619Author:Michael Baye, Jeff PrincePublisher:McGraw-Hill Education
Principles of Economics (12th Edition)
Economics
ISBN:9780134078779
Author:Karl E. Case, Ray C. Fair, Sharon E. Oster
Publisher:PEARSON
Engineering Economy (17th Edition)
Economics
ISBN:9780134870069
Author:William G. Sullivan, Elin M. Wicks, C. Patrick Koelling
Publisher:PEARSON
Principles of Economics (MindTap Course List)
Economics
ISBN:9781305585126
Author:N. Gregory Mankiw
Publisher:Cengage Learning
Managerial Economics: A Problem Solving Approach
Economics
ISBN:9781337106665
Author:Luke M. Froeb, Brian T. McCann, Michael R. Ward, Mike Shor
Publisher:Cengage Learning
Managerial Economics & Business Strategy (Mcgraw-...
Economics
ISBN:9781259290619
Author:Michael Baye, Jeff Prince
Publisher:McGraw-Hill Education