GDP per Capita in 1990 International Dollars 1000 1500 1820 1995 Year $425 $420 $545 $675 $5,188 World $439 $406 $624 $1,149 $19,990 The West West Europe 450 400 670 1,269 17,456 North America 400 400 400 1,233 22,933 400 425 525 675 19,720 Japan $423 $424 $532 $594 $2,971 The Rest Other Europe 400 597 803 5,147 400 Latin America 400 415 415 671 5,031 China 450 450 600 600 2,653 Other Asia 425 425 525 560 2,768 Africa 400 400 400 400 1,221 According to the table, by what percentage did GDP per capita increase between 1820 and 1995 in Instructions: Round your responses to one decimal place. a. World? b. The West? c. The Rest?
Q: 1. In 1910 the United S of living) was $6,200. 35 years. What woul
A: Economic growth refers to the change in the real value of the output produced in an economy over a…
Q: Real GDP Nominal GDP GDP Deflator 246,849 103.2 268,914 100.7 257,861 264,308 266,194 105.9 241,646…
A: NOTE: We’ll answer the first question since the exact one wasn’t specified. Please submit a new…
Q: Between 1960 and 2018 U.S. GDP, measured in dollars of constant purchasing power, expanded about 5.0…
A: It is given that the purchasing power of the US citizens have expanded 5 times between 1960 and…
Q: I. GDP Calculations Product Food Clothing Education Health care Price 2019 Quantity 2 P19*Q19 Price…
A: Note:- Since we can only answer up to three subparts, we'll answer the first three. Please repost…
Q: The compensation is 300, consumption is 500, rent income is 200, profit is 100 and direct taxes are…
A: "Since you have asked multiple questions, we will solve the first question for you. If you want any…
Q: What was real per capita GDP in 1933 measured in 2013 prices? Use the data in the table below to…
A: The per capita gross domestic product (GDP) is a financial measure that calculates a country's…
Q: 13. Use the table below to answer the question. Gross Domestic Product Per Capita (GDP) Years in…
A: GDP: It refers to the production of goods and services in an economy which is measured within the…
Q: GDP per 1980 сapta, current 1981 1982 1983 prices (U.S. dollars per сapita) Advanced…
A: The given data shows the GDP per capita of Advanced economies and developing economies. The data…
Q: From the following data, calculate national income by value added (net output) method (Rs. In…
A: Given: Gross value of output at market prices (GVAMP) = Rs. 18,000 crores Value of intermediate…
Q: C I G NX…
A: Nominal GDP is the increment in the income or output level from year to year on the basis of market…
Q: What is the GDP of this economy? Cost of materials Value of sales Value added 250 Farmer Ice-cream…
A: Gross domestic product (GDP) refers to the value of goods and services produced within the domestic…
Q: 2. The following table shows an example of gross domestic product values for five countriesfrom 2005…
A: GDP expanded as the Gross Domestic Product refers to the value of all the final goods and services…
Q: In Foodland, the following products are produced in the economy: milk bread ham Price (USD) Quantity…
A: Nominal GDP is the sum of market value of goods and services produces in an economy during a…
Q: If the real GDP is $600 and price index is 125 calculate the nominal GDP operating '
A:
Q: If the GDP found under Output Approach is 2000, the total of Agriculture sector is 500 and total of…
A:
Q: Year Real GDP Nominal GDP Price Index 2000 $14,500 A 100 2001 $15,500 $17,000 B 2002 $20,000 117…
A: Nominal GDP is defined as the total amount of finished goods and services produced within the…
Q: 2. Fill in the blanks: Real GDP Nominal GDP GDP Deflator (base year (in 2000 dollars) (in current…
A: Gross domestic product (GDP) refers to the total value of all the final goods and services that…
Q: Nature Туре А (10%) Туре В (90%) Player 1-B Player 1-A Out In Out In Player 2\ B 1-B (Player 2 0,0…
A:
Q: Year Real GDP Nominal GDP Price Index 2000 $14,500 A 100 2001 $15,500 $17,000 B 2002 S20,000 117…
A: The price index (GDP deflator ) is calculated as Price index = Nominal GDPReal GDP×100 We have to…
Q: Year (in thousands) thousands) (in thousand 2000 282,434 142,583 5,692 2001 285,545 143,734 6,801…
A: given that, the labor force in 2009 is 154142 thousandths the labor force in 2017 is 160320…
Q: If intermediate consumption is $430 million and value of output is $560 million Calculate value…
A: According to the above mentioned question, the values are:- Intermediate Consumption = $430 Million…
Q: Year Website A GDP Website B GDP $50 million = P1980 Q1980 600 million = P2020*Q2020 1980 $200…
A: Year 1980 Website A GDP $50 million = P1980 * Q1980 Website B GDP $200 million = P2020 * Q1980…
Q: The table below showsa country's potential Gross Domestic Product (GDP) and true GDP Yeare 1970e…
A: (i) In order to plot the following points on the graphical region, we will need two axes with one…
Q: Year Real GDP Nominal GDP Price Index 2000 $14,500 A 100 2001 $15,500 $17,000 2002 $20,000 117 2003…
A: GDP is affected by changes in the price level. An increase in price level reflects an increase in…
Q: Year Waffles (Quantity) Waffles (Price) Orange Juice (Quantity) Orange Juice (Price) Toaster Ovens…
A: (a) Price of the market basket in the Year 2011 = (Quantity consumed of waffles × Price of waffles)…
Q: Using the data In the table below related to nominal GDP, real GDP, and total population, answer the…
A: From the tabular data, Year Nominal GDP (in millions) Real GDP (in million) Population (in…
Q: 2. Use the data below to do a 3 year and 5 year mov Explain what happens to the data. Year Data 1996…
A: *Answer:
Q: Using the data In the table below related to nominal GDP, real GDP, and total population, answer the…
A: Nominal GDP per capita (2010) = Nominal GDPTotal Population…
Q: Nominal GDP (NGDP) Real GDP (RGDP) Estimated Resident Population by Age and ata Sex (1991+)…
A: Real GDP is an estimation of financial yield that represents the impacts of swelling or deflation.…
Q: If the real GNP for current year is 83 and the nominal GNP for current year is 194 calculate the…
A:
Q: What is Gross Value Added? What is GVA of banana industry in the Philippines?
A: Since you have asked multiple question, we will solve the first question for you. If you want any…
Q: Table 23.1: Vital Economic Statistics for An Earthly Economy Nominal RGDP Total GDP Price Population…
A: The formula is:Real GDP =( Nominal GDP/Price index)*100Real GDP in year 6=(4900/117)*100=4188.03419…
Q: Candie 2000 IC4 ICI 1800 1600 1700 ica 100 300 400 500 Toys a Exports toys 200 and imports candles…
A: The following problem has been answered as follows:
Q: ountry of Economica's GDP deflator and nominal GDP in three different years are shown in the table.…
A: Here we have to find real GDP .
Q: Total Total MSMES Total Micro MSMES Total Small Medium MSMES District Baleshwa MSMES 27170 26337 797…
A: Coefficient of Variation = Population Standard DeviationPopulation Mean
Q: 2001 the value of RGDP was $12.40 trillion, the population was 282.19 million, and the umber of…
A: Real GDP measures the value of goods and services using constant set of prices.
Q: Year Nominal GDP Real GDP Price Index 1 5,200 4,800 5,500 112 3 5,740 5,000 Refer to the table. (GDP…
A: The formula is:Real GDP = nominal GDPPrice index×100 =5500112*100=4910.71429=4910.71
Q: 12. Income level or GDP is criticized as an indicator of development mainly because it takes no…
A: Answer: True Explanation: Yes, the GDP fails to indicate the distribution of income and this leads…
Q: 18. Calculate the gross domestic product for the economy with the following data: Indicators Amount…
A: Note:- Hi! Thank you for the question, As per the honor code, we are allowed to answer one question…
Q: Statistics Units 2016 2017 2018 2019 202 Real GDP National A1 2,813.09 2,893.16 2,844.56 2,671…
A: The International Monetary Fund can be defined as an advanced international monetary strength and…
Q: Compute the nominal GDP Year: 2021 Value added of agriculture, fishery and forestry sector Value…
A: Nominal GDP = C+I+G+NX
Q: Using data from Table 19.5 how much of the nominal GDP growth from 1980 to 1990 was real GDP and how…
A: The measure that is known to depict the final value of goods and services that are being produced…
Q: Below is a hypothetical table such as would be generated by the Bureau of Labor Statistics when…
A: Gross Domestic Product is the sum of personal consumption expenditure, gross private domestic…
Q: Year Real GDP Nominal GDP Price Index 2000 $14,500 100 2001 $15,500 $17,000 2002 $20,000 117 2003…
A: Nominal GDP refers the value of total goods and services produced by an economy and it doesn't…
Q: 1) Fill in the rest of this table. Use 2002 as the base year. Year Tons Price Tons of Price Nominal…
A: Nominal GDP refers to the value of goods and services measured in current year market price and real…
Q: 1. There is a country, which is located in the south of the Mediterranean. This country's GDP is 500…
A: The auto sector accounts for the second most extensive reference for growing CO2 emissions globally.…
Q: Nominal GDP Real GDP Price Index Year (Billions) (Billions) (Year 0 = 100) %3D 1 15,064.4 101.4 2…
A: Nominal GDP is an appraisal of monetary creation in an economy however remembers the current prices…
Q: Nominal Year ČPI Real GDP GDP 1980 $2857.31 82.38 1981 $3207.04 90.93 1982 $3343.79 96.55 1983…
A: The measure that depicts the final values of goods and services being produced in an economy during…
Q: Year Nominal GDP Real GDP Price Index 1 4,900 4,800 2 5,000 5,000 5,400 5,100 Refer to the table.…
A: The GDP Price Index computes the annualized change in the prices of all GDP-included goods and…
Please as soon as possible.thank you
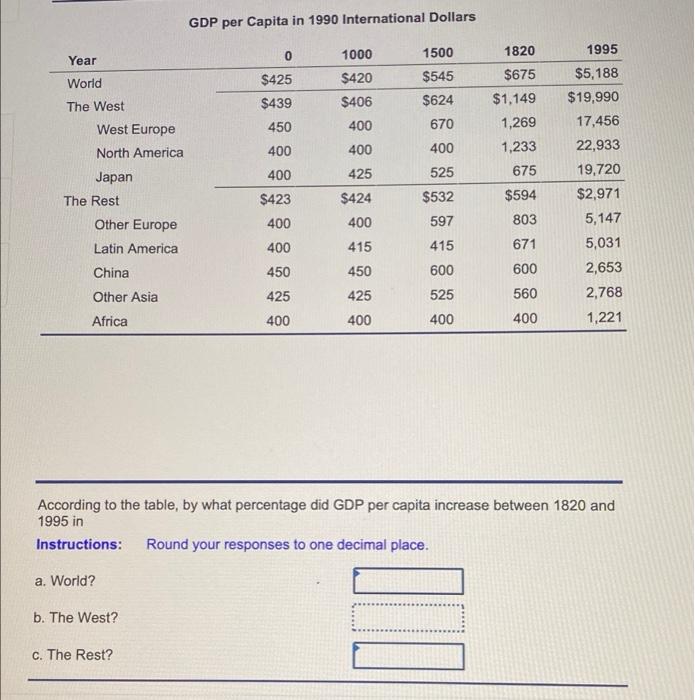
Trending now
This is a popular solution!
Step by step
Solved in 2 steps
- What is the current real GDP per person in South Africa? How has this changed over the past 10 years?GRAPH SETTINGS Reset Country-X Initial Value ($50 – $10,000) 1,000.00 Value (thousands of dollars) [Country-X = Country-Y] Growth Rate: 3% 10 0.1% 10.0% 8 Country-Y 7 Initial Value 2,000.00 ($50 – $10,000) 5 4 Growth Rate: 1% 0.1% 10.0% 2 1 35.4 уrs. E CALCULATIONS 0 5 10 15 20 25 30 35 40 Years Value in Country-X Country-Y 10 years $1,343.92 $2,209.24 20 years $1,806.11 $2,440.38 30 years $2,427.26 $2,695.70 Country-X Country-Y Instructions: Modify the settings in the interactive tool as needed to answer the questions below. Suppose countries X and Y each produce $2,000 of goods and services per year. Country X experiences 2% growth per year, while country Y experiences 4% growth per year. a) What is Country X's production after 20 years? $[ b) What is country Y's production after 20 years? c) If two amounts are initially equal but one grows twice as fast (ex: 2% growth versus 4% growth), the amount that grows faster will have increased by (Click to select) V twice as much.Consider the following diagram, which includes a concave line of best fit: 40,000- •US 35,000 - 30,000 - •Belgium Switzerland •UK 25,000 - •Japan 20,000- • •Taiwan 15.000 - 10,000 - •Ecuador 5,000- aindia 0. 10.000 20,000 30,000 40,000 50,000 60,000 70,000 80,000 Figure 15 3 Canital ond GDP ner worker across countries in 199n Which of the following statements is correct? Select one: O a. The line of best fit suggests that if capital intensity doubles, output per person doubles. O b. The line of best fit implies that there are diminishing returns to scale. O c. The line of best fit suggests that the USA may have a higher value of "z" than Japan. O d. Workers in Japan were more productive than in the UK because they had higher capital per worker. GDP per worker (1985 PPP $)
- 1960 South Korea Mexico 2012 South Korea Mexico Population, total (in millions) 25 38.7 50 120.8 e GDP (in billions of constant 2005 US$) 27.7 127.6 1165.3 1031.1 Source: World Development Indicators. Calculate per capita GDP for each country and year. Don't use commas or dollar signs, and round to the nearest dollar. • South Korea, 1960: 1108 • Mexico, 1960: type your answer... • South Korea: 2012: 23306 • Mexico, 2012: type your answer... • Did the standard of living rise in both countries? (type either yes or no): type your answer... • Which country saw the greater increase in living standards? type your answer... According to the PPF model, why might this country have had a greater increase in living standards? (Type the letter that corresponds to the best answer.) a. This country created more capital. b. This country's population increased more. c. This country adopted more advanced tecnhology. d. All of the above are consistent with the PPF model and the data. e. (a) and (c) only…Give typing answer with explanation and conclusion What are the top 10 countries by GDP/capita and what are their actual GDP/person numbers in USD$?In 1980, Denmark had a GDP of 70 billion (measured in U.S. dollars} and a population of 5.1 million. In 2000, Denmark had 3 GDP of 160 billion (measured in U.S. dollars} and a population of 5.3 million. By what percentage did Denmarks GDP per capita rise between 1980 and 2000?
- GRAPH SETTINGS Reset Country-X Initial Value ($50 – $10,000) 1,000.00 Value (thousands of dollars) [Country-X = Country-Y] Growth Rate: 3% 10 9 0.1% 10.0% 8 Country-Y 7 Initial Value 6 2,000.00 ($50 – $10,000) 4 Growth Rate: 1% 3 0.1% 10.0% 2 35.4 уrs. CALCULATIONS 0 5 20 35 40 10 15 25 30 Years Value in Country-X Country-Y 10 years $1,343.92 $2,209.24 20 years $1,806.11 $2,440.38 30 years $2,427.26 $2,695.70 Country-X Country-Y Instructions: Modify the settings in the interactive tool as needed to answer the questions below. Suppose country X currently produces $1800 of goods and services per year with a constant growth rate of 4.8% per year. Country Y's production is currently $4500 with growth of 3.0% per year. a) Using the rule of 72, how long does it take for country X's production to double? | years b) Using the rule of 72, how long does it take for country Y's production to double? | years c) Even if an intersection point does not appear on the graph, will the production level…High-income countries United States Canada Japan France Middle-income countries i China India Libya Low-income countries Burundi Haiti Ethiopia Average Growth Rate (2000-2018) of GDP Population. 1.7 1.9 0.7 1.1 9.5 6.8 -1.2 3.1 1.4 9.8 0.8 1.0 0.0 0.6 0.5 1.4 1.2 3.1 1.5 2.8 Per Capita GDP 0.9 0.9 0,7 0.5 9.0 5.4 -2.4 0.0 -0.1 7.0 Assuming the 2019 per capita GDP growth rate is equal to the average growth rate (2000-2018) provided in the table, estimate 2019 per capita GDP for each of the following countries: Instructions: Round your responses to the nearest dollar. a. Japan: $[ b. Haiti: SThe table below shows the real GDP and population for the years 2000 and 2010 of a small island nation. Year Real GDP Population 發 2000 10,000 800 2010 22,000 950 Where applicable, round your answers to two decimal places. (a) Calculate the annual growth rate of real GDP over the 10 years (from 2000 to 2010). (b) Calculate the annual growth rate of real GDP per capita over the 10 years (from 2000 to 2010).
- Given the table below, calculate the population growth (number of individuals) in this country for 2010, 2015 and 2020. The result should be an integer number (no decimals). Round to the nearest number. E.g if the result is 350.4, write 350. If the result is 350.5, write 351. Number of individuals 2010 2015 2020 Births Deaths Immigration Emigration 5000 6000 7000 5500 5600 6000 850 2000 3000 450 500 600 Write the population growth (number of individuals) for 2010 in Blank #1. Write the population growth (number of individuals) for 2015 in Blank #2. Write the population growth (number of individuals) for 2020 in Blank # 3. Blank # 1 Blank # 2 Blank # 3K Consider the following data: Country A B C Population (millions) 11 20 4 B C What is the per capita real GDP in each of these countries (Enter each response rounded to the nearest integer)? Country Per Capita Real GDP $6,500 Real GDP ($ billions) 52 59 75 $ Note:- Do not provide handwritten solution. Maintain accuracy and quality in your answer. Take care of plagiarism. Answer completely. You will get up vote for sure.Demography can have important economic effects. The United States has an aging population. Explain one economic benefit and one economic cost of an aging population as well as of a population that is very young.