
MATLAB: An Introduction with Applications
6th Edition
ISBN: 9781119256830
Author: Amos Gilat
Publisher: John Wiley & Sons Inc
expand_more
expand_more
format_list_bulleted
Related questions
Concept explainers
Question
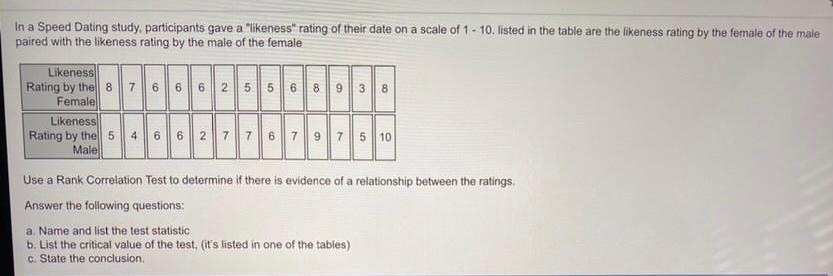

Transcribed Image Text:In a Speed Dating study, participants gave a "likeness" rating of their date on a scale of 1-10. listed in the table are the likeness rating by the female of the male
paired with the likeness rating by the male of the female
Likeness
Rating by the 8 76 66 2 5568 938
Female
Likeness
Rating by the 5 466 27 76 79 7 5 10
Male
Use a Rank Correlation Test to determine if there is evidence of a relationship between the ratings.
Answer the following questions:
a. Name and list the test statistic
b. List the critical value of the test, (it's listed in one of the tables)
c. State the conclusion.
Expert Solution
This question has been solved!
Explore an expertly crafted, step-by-step solution for a thorough understanding of key concepts.

Step by stepSolved in 5 steps with 5 images

Knowledge Booster


Learn more about
Need a deep-dive on the concept behind this application? Look no further. Learn more about this topic, statistics and related others by exploring similar questions and additional content below.Similar questions
- d) Correlation by eye Sample size=45 y 20- 15- og 8. 10- 5. 10 15 20 25 X Try to guess the sample correlation within +/- 0.1 Guess: Correlation: Sample coeficient of correlation a o 00 00arrow_forwardWhich of the following statements about correlation is true? Question content area bottom Part 1 Choose the correct answer below. A. We say that there is a positive correlation between x and y if there is no distinct pattern in the scatterplot. B. We say that there is a positive correlation between x and y if the x-values increase as the corresponding y-values decrease. C. We say that there is a positive correlation between x and y if the x-values increase as the corresponding y-values increase. D. We say that there is a negative correlation between x and y if the x-values increase as the corresponding y-values increasearrow_forwardThe correlation between midterm and final grades for 300 students is 0.620. If 5 points are added to each midterm grade, the new r will be: a. 0.124 b. 0.57 c. 0.62 d. 0.744arrow_forward
- Which value of r indicates a stronger correlation: r= 0.841 or r= - 0.949? Explain your reasoning. Choose the correct answer below. O A. r= 0.841 represents a stronger correlation because -0.949 > 0.841|. B. r= - 0.949 represents a stronger correlation because -0.949|> |0.841|. C. r= - 0.949 represents a stronger correlation because 0.841 > - 0.949. D. r= 0.841 represents a stronger correlation because 0.841 > - 0.949.arrow_forwardOA. Tip Amount ($) Construct a scatterplot. Choose the correct graph below. 25- The table below includes data from taxi rides. The distances are in miles, the times are in minutes, the fares are in dollars, and the tips are in dollars. Is there sufficient evidence to conclude that there is a linear correlation between the time of the ride and the tip amount? Construct a scatterplot, find the value of the linear correlation coefficient r, and find the P-value of r. Determine whether there is sufficient evidence to support a claim of linear correlation between the two variables. Use a significance level of a 0.01. Does it appear that riders base their tips on the time of the ride? Click here for information on the taxi rides. 0 35 Ride time (minutes) Determine the linear correlation coefficient. The linear correlation coefficient is r= (Round to three decimal places as needed.) Tip Amount ($) B. Q 25- Q 0- 0 35 Ride time (minutes) Tip Amount ($) C. 25- Q 0 35 G Ride time (minutes) O D.…arrow_forward12.2 ONLY!arrow_forward
- Match each scatterplot shown below with one of the four specified correlations Please helparrow_forwardCompute and interpret the coefficient of multiple correlation. Number 4 answer is missing.arrow_forwardListed are 4 correlations. Put them in order showing the highest to lowest degree of relationship: +0.08 -0.27 +0.99 -0.48arrow_forward
arrow_back_ios
arrow_forward_ios
Recommended textbooks for you
- MATLAB: An Introduction with ApplicationsStatisticsISBN:9781119256830Author:Amos GilatPublisher:John Wiley & Sons Inc
 Probability and Statistics for Engineering and th...StatisticsISBN:9781305251809Author:Jay L. DevorePublisher:Cengage Learning
 Statistics for The Behavioral Sciences (MindTap C...StatisticsISBN:9781305504912Author:Frederick J Gravetter, Larry B. WallnauPublisher:Cengage Learning
  Elementary Statistics: Picturing the World (7th E...StatisticsISBN:9780134683416Author:Ron Larson, Betsy FarberPublisher:PEARSON
 The Basic Practice of StatisticsStatisticsISBN:9781319042578Author:David S. Moore, William I. Notz, Michael A. FlignerPublisher:W. H. Freeman
 Introduction to the Practice of StatisticsStatisticsISBN:9781319013387Author:David S. Moore, George P. McCabe, Bruce A. CraigPublisher:W. H. Freeman
MATLAB: An Introduction with Applications
Statistics
ISBN:9781119256830
Author:Amos Gilat
Publisher:John Wiley & Sons Inc
Probability and Statistics for Engineering and th...
Statistics
ISBN:9781305251809
Author:Jay L. Devore
Publisher:Cengage Learning
Statistics for The Behavioral Sciences (MindTap C...
Statistics
ISBN:9781305504912
Author:Frederick J Gravetter, Larry B. Wallnau
Publisher:Cengage Learning
Elementary Statistics: Picturing the World (7th E...
Statistics
ISBN:9780134683416
Author:Ron Larson, Betsy Farber
Publisher:PEARSON
The Basic Practice of Statistics
Statistics
ISBN:9781319042578
Author:David S. Moore, William I. Notz, Michael A. Fligner
Publisher:W. H. Freeman
Introduction to the Practice of Statistics
Statistics
ISBN:9781319013387
Author:David S. Moore, George P. McCabe, Bruce A. Craig
Publisher:W. H. Freeman