
MATLAB: An Introduction with Applications
6th Edition
ISBN: 9781119256830
Author: Amos Gilat
Publisher: John Wiley & Sons Inc
expand_more
expand_more
format_list_bulleted
Related questions
Concept explainers
Topic Video
Question
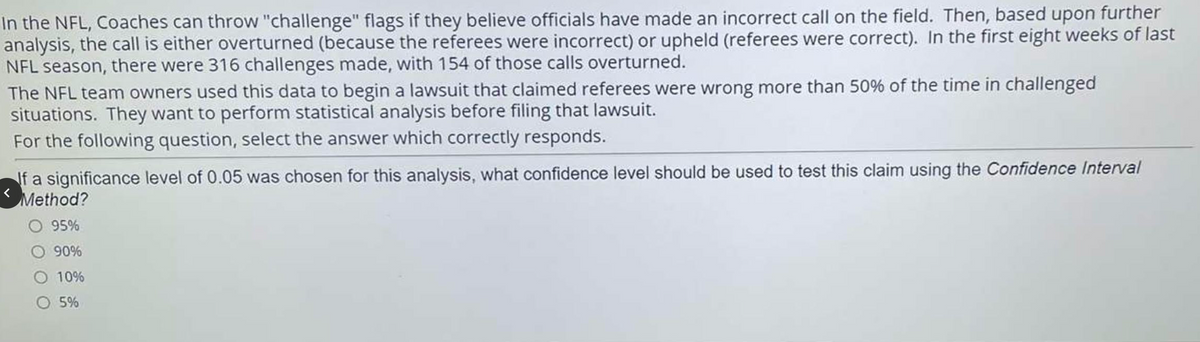

Transcribed Image Text:In the NFL, Coaches can throw "challenge" flags if they believe officials have made an incorrect call on the field. Then, based upon further
analysis, the call is either overturned (because the referees were incorrect) or upheld (referees were correct). In the first eight weeks of last
NFL season, there were 316 challenges made, with 154 of those calls overturned.
The NFL team owners used this data to begin a lawsuit that claimed referees were wrong more than 50% of the time in challenged
situations. They want to perform statistical analysis before filing that lawsuit.
For the following question, select the answer which correctly responds.
If a significance level of 0.05 was chosen for this analysis, what confidence level should be used to test this claim using the Confidence Interval
Method?
O 95%
O 90%
10%
O 5%
Expert Solution
This question has been solved!
Explore an expertly crafted, step-by-step solution for a thorough understanding of key concepts.

This is a popular solution

Trending nowThis is a popular solution!

Step by stepSolved in 2 steps

Knowledge Booster


Learn more about
Need a deep-dive on the concept behind this application? Look no further. Learn more about this topic, statistics and related others by exploring similar questions and additional content below.Similar questions
- A researcher is interested in factors related to academic performance of students. She hypothesized that for undergraduate students, there is an association between academic majors (STEM, Business, Education, Nursing) and amount of time spent studying each week (less than 3 days, 3 to 6 days, everyday). To test her hypothesis, she randomly selected 1000 undergraduate students from various colleges/universities in Texas, and then classified each participant according to their major and amount of study time each week. For her study, she found test-statistic of 23.75 and a p-value of 0.0006. Using this information, fill in the necessary information below for her test. Distribution used: a. chi-square distribution, 3 degrees of freedom b. chi-square distribution, 4 degrees of freedom c. chi-square distribution, 6 degrees of freedom d. chi-square distribution, 12 degrees of freedomarrow_forwardAlcohol abuse has been described by college presidents as the number one problem on campus, and it is an important cause of death in young adults. How common is it? A survey of 10,904 randomly selected U.S. college students collected information on drinking behavior and alcohol-related problems. The researchers defined “frequent binge drinking” as having five or more drinks in a row three or more times in the past two weeks. According to this definition, 2486 students were classified as frequent binge drinkers. Construct and interpret a 99% confidence interval for the proportion of students who are classified as binge drinkers. (Use the four-step process and Table A to get your z* value.) Using the interval that you calculated in the last question, conclude in context for the question.arrow_forwardIn a study about learning styles, researchers used a group of 64 elementary school students who volunteered to be part of the study. The researchers gave each student a pre-test and based upon the results, they divided them into 32 pairs of similarly scoring students. School administrators then randomly assigned one student from each pair to mathematics instruction online while the other student received in-person instruction in a traditional classroom. At the end of the year, all 64 students received a mathematics assessment, measured on a 100-point scale. The researchers calculated the difference (in person −− online) in the mathematics assessment scores for each pair of students. The 32 differences had a mean of 15 and a standard deviation of 3.9 points. Construct and interpret a 95% confidence interval for the mean difference (in person −− online) in the mathematics assessment scores for all pairs of students like these who learn math either face-to-face or online.arrow_forward
- In a survey of 1220 adults in a country, 58% said the country's leader should release all medical information that might affect their ability to serve. The study is observational, an experiment, because it applies does not apply a treatment to the adults.arrow_forwardWould observations or interviews be more appropriate to research the following topic?People's behaviors at dog parks.O ObservationO Interviewsarrow_forwardThe Bureau of Labor Statistics reports that the official unemployment rate for Black people was 10.4% and 4.7% for White people in February 2015. Select all correct answers for this question. O The samples of white and black people are independent. The explanatory variable is the unemployment rate. The response variable is the unemployment rate. The response variable is race.arrow_forward
- By a small margin, Facebook remains the top choice of social media over all ages, with 29% using Facebook most often among those using social media sites. However, more visually oriented social networks such as Snapchat and Instagram continue to draw in younger audiences. When asked "Which one social networking brand do you use most often?" the results in the table show the top brands chosen by Americans aged 12-34 who currently use any social networking site or service. Social M edia Site Faceboo k Snapchat Instagra m Twitter Percentage That Use Most Often 29 28 26 6 20 (a) What is the sum of the percentages for these top social media sites? Give your answer as an exact number. Macmillan Learning top social media sites: What percent of Americans aged 12-34 use other social media sites most often? Give your answer as an exact number. other social media sites: do %arrow_forwardwould this be a one tail or two tail test?arrow_forwardUSA Today posted this question on the electronic version of its newspaper: “Should guys pay for their first date?” Of the 1148 subjects who decided to respond, 85% of them said “yes.” (a) Determine whether the study is an experimental or an observational study.arrow_forward
- In a study about learning styles, researchers used a group of 64 elementary school students who volunteered to be part of the study. The researchers gave each student a pre-test and based upon the results, they divided them into 32 pairs of similarly scoring students. School administrators then randomly assigned one student from each pair to mathematics instruction online while the other student received in-person instruction in a traditional classroom. At the end of the year, all 64 students received a mathematics assessment, measured on a 100-point scale. The researchers calculated the difference (in person −− online) in the mathematics assessment scores for each pair of students. The 32 differences had a mean of 15 and a standard deviation of 3.9 points. Construct and interpret a 95% confidence interval for the mean difference (in person −− online) in the mathematics assessment scores for all pairs of students like these who learn math either face-to-face or online.arrow_forwardThe Consumer Reports Restaurant Customer Satisfaction Survey is based upon 148,599 visits to full-service restaurant chains (Consumer Reports website). One of the variables in the study is meal price, the average amount paid per person for dinner and drinks, minus the tip. Suppose a reporter for the Sun Coast Times thought that it would be of interest to her readers to conduct a similar study for restaurants located on the Grand Strand section in Myrtle Beach, South Carolina. The reporter selected a sample of 8 seafood restaurants, 8 Italian restaurants, and 8 steakhouses. The following data show the meal prices ($) obtained for the 24 restaurants sampled. Use a = 0.05 to test whether there is a significant difference among the mean meal price for the three types of restaurants. Source Sum of Squares Degrees Mean Square F P-value of Variation (to whole number) of Freedom (to 2 decimals) (to 2 decimals) (to 4 decimals) X X (X) * X * * Treatments Error Total The p-value is less than 0.01…arrow_forwardA businesswoman is considering whether to open a coffee shop in a local shopping center. Before making this decision, she wants to know how much money people spend per week at coffee shops in that area. She took a random sample of 26 customers from the area who visit coffee shops and asked them to record the amount of money (in dollars) they would spend during the next week at coffee shops. At the end of the week, she obtained the following data (in dollars) from these 26 customers: 16.63 38.63 15.14 14.47 5.01 63.64 10.19 13.28 32.25 36.00 16.19 65.91 10.28 37.14 3.22 6.92 34.65 6.40 36.35 27.59 38.67 13.18 9.80 9.48 1.21 5.19 Assume that the distribution of weekly expenditures at coffee shops by all customers who visit coffee shops in this area is approximately normal. Round your answers to cents.a. What is the point estimate of the corresponding population mean?x¯=$b. Make a 99% confidence interval for the average amount of money spent per week at coffee shops by all…arrow_forward
arrow_back_ios
SEE MORE QUESTIONS
arrow_forward_ios
Recommended textbooks for you
- MATLAB: An Introduction with ApplicationsStatisticsISBN:9781119256830Author:Amos GilatPublisher:John Wiley & Sons Inc
 Probability and Statistics for Engineering and th...StatisticsISBN:9781305251809Author:Jay L. DevorePublisher:Cengage Learning
 Statistics for The Behavioral Sciences (MindTap C...StatisticsISBN:9781305504912Author:Frederick J Gravetter, Larry B. WallnauPublisher:Cengage Learning
  Elementary Statistics: Picturing the World (7th E...StatisticsISBN:9780134683416Author:Ron Larson, Betsy FarberPublisher:PEARSON
 The Basic Practice of StatisticsStatisticsISBN:9781319042578Author:David S. Moore, William I. Notz, Michael A. FlignerPublisher:W. H. Freeman
 Introduction to the Practice of StatisticsStatisticsISBN:9781319013387Author:David S. Moore, George P. McCabe, Bruce A. CraigPublisher:W. H. Freeman
MATLAB: An Introduction with Applications
Statistics
ISBN:9781119256830
Author:Amos Gilat
Publisher:John Wiley & Sons Inc
Probability and Statistics for Engineering and th...
Statistics
ISBN:9781305251809
Author:Jay L. Devore
Publisher:Cengage Learning
Statistics for The Behavioral Sciences (MindTap C...
Statistics
ISBN:9781305504912
Author:Frederick J Gravetter, Larry B. Wallnau
Publisher:Cengage Learning
Elementary Statistics: Picturing the World (7th E...
Statistics
ISBN:9780134683416
Author:Ron Larson, Betsy Farber
Publisher:PEARSON
The Basic Practice of Statistics
Statistics
ISBN:9781319042578
Author:David S. Moore, William I. Notz, Michael A. Fligner
Publisher:W. H. Freeman
Introduction to the Practice of Statistics
Statistics
ISBN:9781319013387
Author:David S. Moore, George P. McCabe, Bruce A. Craig
Publisher:W. H. Freeman