
MATLAB: An Introduction with Applications
6th Edition
ISBN: 9781119256830
Author: Amos Gilat
Publisher: John Wiley & Sons Inc
expand_more
expand_more
format_list_bulleted
Related questions
Question
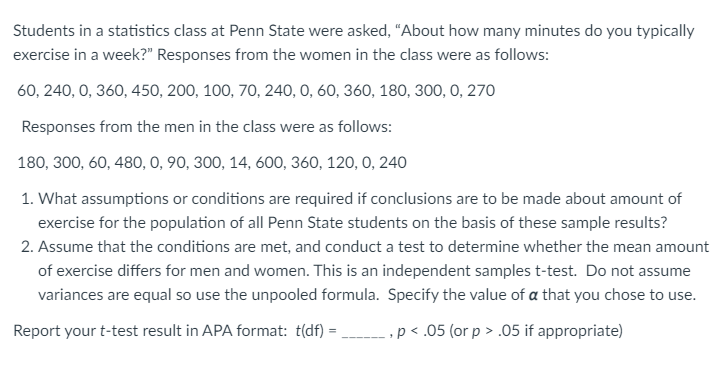

Transcribed Image Text:Students in a statistics class at Penn State were asked, "About how many minutes do you typically
exercise in a week?" Responses from the women in the class were as follows:
60, 240, 0, 360, 450, 200, 100, 70, 240, 0, 60, 360, 180, 300, 0, 270
Responses from the men in the class were as follows:
180, 300, 60, 480, 0, 90, 300, 14, 600, 360, 120, 0, 240
1. What assumptions or conditions are required if conclusions are to be made about amount of
exercise for the population of all Penn State students on the basis of these sample results?
2. Assume that the conditions are met, and conduct a test to determine whether the mean amount
of exercise differs for men and women. This is an independent samples t-test. Do not assume
variances are equal so use the unpooled formula. Specify the value of a that you chose to use.
Report your t-test result in APA format: t(df) = p< .05 (or p > .05 if appropriate)
Expert Solution
This question has been solved!
Explore an expertly crafted, step-by-step solution for a thorough understanding of key concepts.

This is a popular solution

Trending nowThis is a popular solution!

Step by stepSolved in 7 steps

Knowledge Booster

Similar questions
- Use the following for the next two questions: The Hershey Company wants to know if it is doing better in the US than its biggest competitor, Nestle, during their biggest sales month of October. A random sample of 50 US grocery stores are chosen and their October, 2020 sales records are collected. Let ???? and ???? be the true average sales in millions of dollars of Hershey and Nestle products sold in US grocery stores during October, 2020 respectively. The 95% confidence interval for ???? − ???? from our sample data is (54, 346) millions of dollars What is the difference in the sample means ??̅?? − ??̅??? Round to the nearest whole number. 200arrow_forwardStudents in a math class took a 10 point quiz. The scores were: 3, 6, 6, 7, 7, 8, 8, 8, 8, 8, 8, 9, 9, 9, 10, 10, 10 What is mean ? What is IQR?arrow_forwardCan you please help with all 3 parts of this question: To test for a relationship between gender and souvenir shopping, a survey of more than 2,000 tourists was conducted. One question asked how often a tourist purchases photographs, postcards, or paintings of the region visited. Responses were recorded as “always”, “often”, “occasionally”, or “rarely or never”. The table shows the number of tourists responding in each category by gender. Male Female Aways 275 445 Often 420 500 Occasionally 390 425 Rarely or never 305 230 a. Give the marginal distribution of responses. b. Give the conditional distribution of responses for each gender. Do you think there is a relationship between gender and souvenir purchase frequency? c. Test for a relationship between gender and souvenir purchase frequency at a significance level of 0.1.arrow_forward
- a. P(Democrat|same) = b. P(Democrat and same) =arrow_forwardDr. A. Ventura is interested in determining what kinds and how many pets people own in Bakersfield. He stands outside Petco and asks people what kind of pet they own. This is the result of his survey: dog=1; cat=2; bird=3; reptile=4; fish=5; other=6 1,1,2,2,2,1,1,3,2,3,1,1,1,2,2,4,4,2,2,1,1,1,5,4,3,4,1,1,1,2,2,6,1,1,2,2,1,2,1,2,6,3,4,5arrow_forwardA professor wanted to study the number of hours statistics students spend studyingstatistics each week. Out of 19 statistics sections at Santa Ana College, the professorsurveyed each student from 3 randomly selected sections. What is the largest group ofstudents the results of this study can represent?a. All Santa Ana College studentsb. All Santa Ana College students taking a math classc. All Santa Ana College students taking a statistics classd. Students in the three sections the professor surveyedarrow_forward
- Suppose we want to compare the GPA for students in at least three different social classes (Upper, Middle, Working). We obtain GPA records for a randomly selected set of 30 students, ten from each social class group. What test should you use and why?arrow_forwardA group of 499 students were surveyed about the courses they were taking at their college with the following results:228 students said they were taking Math.213 students said they were taking English.237 students said they were taking History.61 students said they were taking Math and English.84 students said they were taking Math and History.74 students said they were taking English and History.17 students said they were taking all three courses.How many students took Math, English, or History ?arrow_forwarda list of the over 2300 Henry Clay high School is compiled. from that list 250 names are randomly chosen and given a survey to complete. of those surveyed 72% said they intended to attend college after completing high school what would the 250 students surveyed would be an example of?arrow_forward
arrow_back_ios
SEE MORE QUESTIONS
arrow_forward_ios
Recommended textbooks for you
- MATLAB: An Introduction with ApplicationsStatisticsISBN:9781119256830Author:Amos GilatPublisher:John Wiley & Sons Inc
 Probability and Statistics for Engineering and th...StatisticsISBN:9781305251809Author:Jay L. DevorePublisher:Cengage Learning
 Statistics for The Behavioral Sciences (MindTap C...StatisticsISBN:9781305504912Author:Frederick J Gravetter, Larry B. WallnauPublisher:Cengage Learning
  Elementary Statistics: Picturing the World (7th E...StatisticsISBN:9780134683416Author:Ron Larson, Betsy FarberPublisher:PEARSON
 The Basic Practice of StatisticsStatisticsISBN:9781319042578Author:David S. Moore, William I. Notz, Michael A. FlignerPublisher:W. H. Freeman
 Introduction to the Practice of StatisticsStatisticsISBN:9781319013387Author:David S. Moore, George P. McCabe, Bruce A. CraigPublisher:W. H. Freeman
MATLAB: An Introduction with Applications
Statistics
ISBN:9781119256830
Author:Amos Gilat
Publisher:John Wiley & Sons Inc
Probability and Statistics for Engineering and th...
Statistics
ISBN:9781305251809
Author:Jay L. Devore
Publisher:Cengage Learning
Statistics for The Behavioral Sciences (MindTap C...
Statistics
ISBN:9781305504912
Author:Frederick J Gravetter, Larry B. Wallnau
Publisher:Cengage Learning
Elementary Statistics: Picturing the World (7th E...
Statistics
ISBN:9780134683416
Author:Ron Larson, Betsy Farber
Publisher:PEARSON
The Basic Practice of Statistics
Statistics
ISBN:9781319042578
Author:David S. Moore, William I. Notz, Michael A. Fligner
Publisher:W. H. Freeman
Introduction to the Practice of Statistics
Statistics
ISBN:9781319013387
Author:David S. Moore, George P. McCabe, Bruce A. Craig
Publisher:W. H. Freeman