
MATLAB: An Introduction with Applications
6th Edition
ISBN: 9781119256830
Author: Amos Gilat
Publisher: John Wiley & Sons Inc
expand_more
expand_more
format_list_bulleted
Related questions
Question

Transcribed Image Text:### Hypothesis Testing and Statistical Analysis
**Objective:**
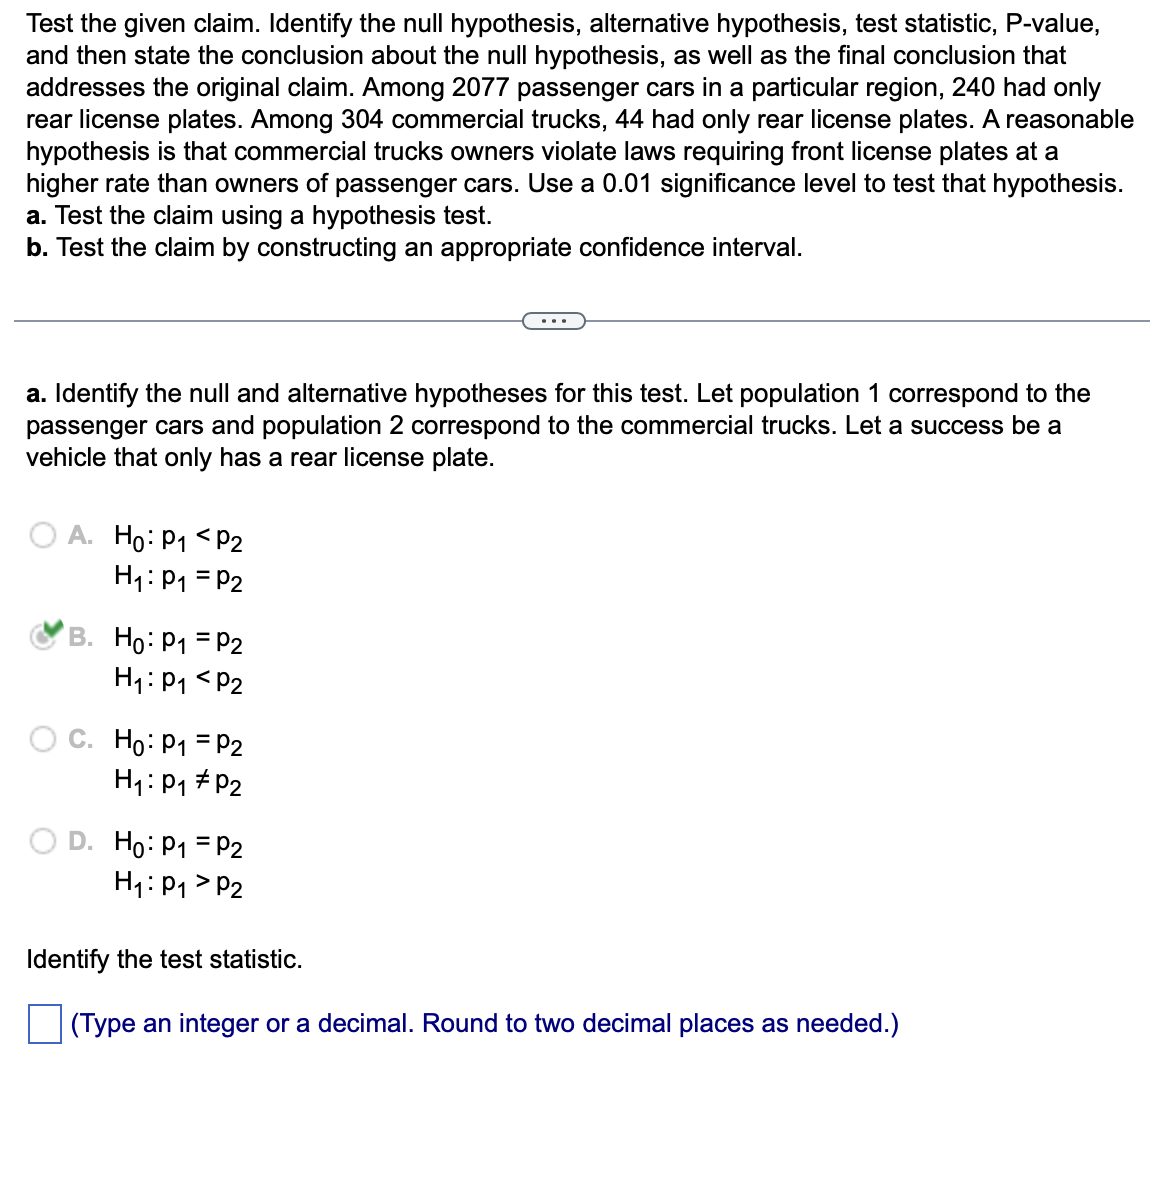
Test the given claim about commercial trucks and passenger cars regarding rear license plates.
**Context:**
- **Passenger Cars:** 2077 in total; 240 have only rear plates.
- **Commercial Trucks:** 304 in total; 44 have only rear plates.
- **Hypothesis:** Commercial trucks violate front license plate laws at a higher rate than passenger cars.
- **Significance Level:** 0.01
**Tasks:**
a. Use a hypothesis test.
b. Construct a confidence interval.
---
#### a. Identifying Hypotheses
**Null and Alternative Hypotheses Definitions:**
- **Population 1:** Passenger cars
- **Population 2:** Commercial trucks
The categorization of success is a vehicle having only a rear license plate.
**Options for Hypotheses:**
- **A.**
\( H_0: p_1 < p_2 \)
\( H_1: p_1 = p_2 \)
- **B.** (Selected as correct)
\( H_0: p_1 = p_2 \)
\( H_1: p_1 < p_2 \)
- **C.**
\( H_0: p_1 = p_2 \)
\( H_1: p_1 \neq p_2 \)
- **D.**
\( H_0: p_1 = p_2 \)
\( H_1: p_1 > p_2 \)
**Next Step:** Identify the test statistic.
- **Prompt:** Enter an integer or a decimal, rounded to two decimal places.
This setup guides the hypothesis testing process, crucial for determining compliance with license plate laws.
Expert Solution
This question has been solved!
Explore an expertly crafted, step-by-step solution for a thorough understanding of key concepts.

This is a popular solution

Trending nowThis is a popular solution!

Step by stepSolved in 4 steps with 2 images

Knowledge Booster

Similar questions
- Suppose that in a random selection of 100 colored candies, 24% of them are blue. The candy company claims that the percentage of blue candies is equal to 29%. Use a 0.05 significance level to test that claim. H,: p>0.29 OC. H, p=0.29 H, p#0.29 O D. Ho p+0.29 H, p=0.29 Identify the test statistic for this hypothesis test. The test statistic for this hypothesis test is (Round to two decimal places as needed.) Identify the P-value for this hypothesis test. The P-value for this hypothesis test is (Round to three decimal places as needed.) Identify the conclusion for this hypothesis test. O A. Fail to reject Ho. There is not sufficient evidence to warrant rejection of the claim that the percentage of blue candies is equal to 29% O B. Fail to reject H. There is sufficient evidence to warrant rejection of the claim that the percentage of blue candies is equal to 29% O C. Reject Ho. There is sufficient evidence to warrant rejection of the claim that the percentage of blue candies is equal to…arrow_forwardSuppose that in a random selection of 100 colored candies, 22% of them are blue. The candy company claims that the percentage of blue candies is equal to 30%. Use a 0.10 significance level to test that claim. Identify the null and alternative hypotheses for this test. Choose the correct answer below. O A. Ho: p=0.3 H₁: p=0.3 O B. Ho: p=0.3 H₁: p=0.3 C. Ho: p=0.3 H₁: p>0.3 O D. Ho: p=0.3 H₁: p<0.3 Identify the test statistic for this hypothesis test. The test statistic for this hypothesis test is (Round to two decimal places as needed.) Identify the P-value for this hypothesis test. The P-value for this hypothesis test is (Round to three decimal places as needed.) Identify the conclusion for this hypothesis test. A. Reject Ho. There is sufficient evidence to warrant rejection of the claim that the percentage of blue candies is equal to 30% B. Reject Ho. There is not sufficient evidence to warrant rejection of the claim that the percentage of blue candies is equal to 30% O C. Fail to…arrow_forwardSuppose that in a random selection of 100 colored candies, 21% of them are blue. The candy company claims that the percentage of blue candies is equal to 20%. Use a 0.10 significance level to test that claim. H, p#0.2 Identify the test statistic for this hypothesis test. The test statistic for this hypothesis test is (Round to two decimal places as needed.)arrow_forward
- Suppose that in a random selection of 100 colored candies, 26% of them are blue. The candy company claims that the percentage of blue candies is equal to 21%. Use a 0.10 significance level to test that claim. a. The test statistic for this hypothesis test is (Round to two decimal places as needed.) b. Identify the P-value for this hypothesis test. (Round to three decimal places as needed.)arrow_forwardA simple random sample of front-seat occupants involved in car crashes is obtained. Among 2791 occupants not wearing seat belts, 39 were killed. Among 7644 occupants wearing seat belts, 19 were killed. Use a 0.05 significance level to test the claim that seat belts are effective in reducing fatalities. Complete parts (a) through (c) below. a. Test the claim using a hypothesis test. Consider the first sample to be the sample of occupants not wearing seat belts and the second sample to be the sample of occupants wearing seat belts. What are the null and alternative hypotheses for the hypothesis test? OC. Ho: P1 2 P2 H1: P1 #P2 O B. Ho: P1 = P2 O A. Ho: P1 SP2 H: P1 #P2 H1: P1 P2 O F. Ho: P1 #P2 H: P1 = P2 Identify the test statistic. (Round to two decimal places as needed.) Identify the P-value. P-value = (Round to three decimal places as needed.)arrow_forwardPassed Failed White Results from a civil servant exam are shown in the table to the right. Is there sufficient evidence to support the claim that the results from the test are discriminatory? Use a 0.05 significance level. 20 17 candidates Minority candidates 8 22 O A. Ho: Awhite candidate is not more likely to pass the test than a minority candidate. H,: A white candidate is more likely to pass the test than a minority candidate. B. Ho: White and minority candidates do not have the same chance of passing the test. H,: White and minority candidates have the same chance of passing the test. O C. Ho: Awhite candidate is more likely to pass the test than a minority candidate. H,:A white candidate is not more likely to pass the test than a minority candidate. O D. Ho: White and minority candidates have the same chance of passing the test. H4: White and minority candidates do not have the same chance of passing the test. Determine the test statistic. x? = (Round to three decimal places as…arrow_forward
- Suppose that in a random selection of 100 colored candies, 23% of them are blue. The candy company claims that the percentage of blue candies is equal to 30%. Use a 0.05 significance level to test that claim. Identify the null and alternative hypotheses for this test. Choose the correct answer below. OA. Ho: p=0.3 H₁: p0.3 Oc. Ho: p=0.3 H₁: p 0.3 OD. Ho: p*0.3 H₁: p=0.3 Barrow_forward3arrow_forwardcurryarrow_forward
- A simple random sample of front-seat occupants involved in car crashes is obtained. Among 2999 occupants not wearing seat belts, 31 were killed. Among 7626 occupants wearing seat belts, 14 were killed. Use a 0.05 significance level to test the claim that seat belts are effective in reducing fatalities. Complete parts (a) through (c) below. a. Test the claim using a hypothesis test. Consider the first sample to be the sample of occupants not wearing seat belts and the second sample to be the sample of occupants wearing seat belts. What are the null and alternative hypotheses for the hypothesis test? A. Ho: P₁ ≤P2 H₁: P₁ P2 D. Ho: P₁ P2 H₁: P₁ = P2 Identify the test statistic. B. Ho: P₁ = P2 H₁: P₁ P2 E. Ho: P₁ = P2 H₁: P₁ P2 Z= (Round to two decimal places as needed.) C. Ho: P₁ H₁: P₁ P2 P2 F. Ho: P₁ = P2 H₁: P₁ P2arrow_forwardA study was conducted to determine the proportion of people who dream in black and white instead of color. Among 285 people over the age of 55, 76 dream in black and white, and among 287 people under the age of 25, 10 dream in black and white. Use a 0.01 significance level to test the claim that the proportion of people over 55 who dream in black and white is greater than the proportion for those under 25. Test the claim using a hypothesis test. Consider the first sample to be the sample of people over the age of 55 and the second sample to be the sample of people under the age of 25. What are the null and alternative hypotheses for the hypothesis test? O A. Ho: P1 = P2 H: P1> P2 O B. Ho: P1 = P2 OC. Ho: P1 = P2 H: P Persuasive Spe.docx a Persuasive Spee.doc a PersuasiveSpch.doc tv MacBook Air F10 F9 心. 20 F3 FS esc F1 F2 & $ % 8 9 @ 4 5 6 2 Y W E R K #3arrow_forward3arrow_forward
arrow_back_ios
SEE MORE QUESTIONS
arrow_forward_ios
Recommended textbooks for you
- MATLAB: An Introduction with ApplicationsStatisticsISBN:9781119256830Author:Amos GilatPublisher:John Wiley & Sons Inc
 Probability and Statistics for Engineering and th...StatisticsISBN:9781305251809Author:Jay L. DevorePublisher:Cengage Learning
 Statistics for The Behavioral Sciences (MindTap C...StatisticsISBN:9781305504912Author:Frederick J Gravetter, Larry B. WallnauPublisher:Cengage Learning
  Elementary Statistics: Picturing the World (7th E...StatisticsISBN:9780134683416Author:Ron Larson, Betsy FarberPublisher:PEARSON
 The Basic Practice of StatisticsStatisticsISBN:9781319042578Author:David S. Moore, William I. Notz, Michael A. FlignerPublisher:W. H. Freeman
 Introduction to the Practice of StatisticsStatisticsISBN:9781319013387Author:David S. Moore, George P. McCabe, Bruce A. CraigPublisher:W. H. Freeman
MATLAB: An Introduction with Applications
Statistics
ISBN:9781119256830
Author:Amos Gilat
Publisher:John Wiley & Sons Inc
Probability and Statistics for Engineering and th...
Statistics
ISBN:9781305251809
Author:Jay L. Devore
Publisher:Cengage Learning
Statistics for The Behavioral Sciences (MindTap C...
Statistics
ISBN:9781305504912
Author:Frederick J Gravetter, Larry B. Wallnau
Publisher:Cengage Learning
Elementary Statistics: Picturing the World (7th E...
Statistics
ISBN:9780134683416
Author:Ron Larson, Betsy Farber
Publisher:PEARSON
The Basic Practice of Statistics
Statistics
ISBN:9781319042578
Author:David S. Moore, William I. Notz, Michael A. Fligner
Publisher:W. H. Freeman
Introduction to the Practice of Statistics
Statistics
ISBN:9781319013387
Author:David S. Moore, George P. McCabe, Bruce A. Craig
Publisher:W. H. Freeman