N 02 Η Σιν-xw
Q: BUS – 173 (Applied Statistics) # Determining if the following statement are True and False. If…
A: Correlation coefficients:- The correlation coefficients measures the direction & strength of a…
Q: Compare the simple linear model in Question 2 and the exponential model in Question 3, do you…
A: The coefficient of determination is defined as the proportion of total variability in the dependent…
Q: Which of the following is not a formal condition for inference about a regression estimate?…
A:
Q: A residual plot is a plot in which the residuals are plot ted against the value of the explanatory…
A: Here, we are given 2 residual plots. As mentioned in the question, residual plots can be used to…
Q: The r value and a least squares regression line can be excellent ways to demonstrate the degree of…
A: #The r value and a least squares regression line can be excellent ways to demonstrate the degree of…
Q: A least squares regression line O always implies a cause and effect relationship between x and y can…
A: A least squares regression line is Y = ax+b If x is known, we can predict y
Q: multiple linear regression model with 2 predictor variables and 10 observations, what is the…
A: Given that Number of predictor=k=2 Observation=n=10
Q: 1. Is it possible to predict the mass of an Atlantic Ocean rockfish from its length? A sample of…
A: Note: Hey, since there are multiple questions posted, we will answer first question. If you want any…
Q: Suppose you are interested in studying the relationship between education and wage. More…
A: Regression Model A regression model is a determinant that demonstrates the relationship between a…
Q: A least-squares fitting of a simple regression model minimizes the sum of the squares of the…
A:
Q: When is the standard error of the estimate (in linear regression) large? When the X values…
A: Standard error of estimate =sqrt(sum(ei2)/N-k)), where ei are residuals, N is sample size and k is…
Q: According to the nutrition research, recommendation on the consumption of fiber for children and…
A:
Q: iv) Perform a new regression omitting this point. What is the new slope, the new R2? What does it…
A: From the plot of residuals vs high jump, the 2nd last point seems to be of high leverage. After…
Q: None
A: The OLS estimate of the β₀ parameter in the regression…
Q: Define Nonlinear Least Squares Estimation of a regression function?
A: Given that, Nonlinear Least Squares: Non-linear least squares is the form of least squares analysis…
Q: Use the maximum likehood method in deriving the error variance in regression
A: Consider a linear regression model Y=Xβ + ε The errors are normally and independently distributed…
Q: Critically assess the ten assumptions of the classical linear regression model (CLRM)
A: Assumption 1: The regression model is linear in parameters. (Yi=b0+b1xi+ei). If it is not linear we…
Q: (T/F) in multiple linear regression, if we reject the null hypothesis in the significance test, that…
A: A procedure leading to a decision about a particular hypothesis is called a test of a hypothesis.…
Q: Consider a simple regression Y = B1 + B2 X + u. Suppose we found out that the variance of error term…
A:
Q: In simple linear regression analysis, it is desired to test whether the regression coefficient is…
A: Solution: Given information: Test statistic t = 19 S.E(β1^)= 8 standard error of the regression…
Q: Assume you fit a logistic regression for binary Y [i.e., replace EY in linear regression by…
A:
Q: Multiple linear regression using ‘enter’ in SPSS differs from simple linear regression in that itA.…
A: The correct answer is E. only A and C. In SPSS, the default option for multiple regression is…
Q: If you estimate a regression with multica regressor(s) O True O False
A: Multicollinearity occurs when more than one explanatory variables have linear relationship between…
Q: Given the relatively small sample size, we can characterize the left-hand plot as a random cloud of…
A: Given the relatively small sample size, we can characterize the left-hand plot as a random cloud of…
Q: Jiven fhe fundion belor, solve fer the folewng 2x 3 3 O, elsewhere Vorify that ole.y) isr a joint…
A:
Q: Disk drives last time Here is a scatterplot of the residu-als from the regression of the hard drive…
A: a. The residual plot for the regression of price on capacity for the hard drives mentioned in…
Q: Which of the following assumptions is not necessary for unbiasedness of a slope coefficient in a…
A: Which of the following assumptions is not necessary for unbiasedness of a slope coefficient in a…
Q: In simple linear regression, most often we perform a two-tail test of the population slope 1 to…
A: The study is about performing a two-tail test of the population slope 1 to determine whether there…
Q: A baseball enthusiast carried out a simple linear regression to investigate whether there is a…
A: we wants to find the test statistics value for the significance test of coefficient of slope in a…
Q: Suppose we have a dataset with stock prices (Y) on different time points (X). After performing a…
A: Given information: The residual plot for the data is given.
Q: ONA model is developed for forecasting of sale and the effects of three independent variables ,…
A: Note : Since we only answer up to 3 sub-parts, we’ll answer the first 3. Please resubmit the…
Q: The US government is interested in understanding what predicts death rates. They have a set of data…
A: Coefficient of determination:
Q: 4. Write a Julia function to calculate CV and GCV in the case of smoothing by local linear…
A:
Q: Suppose that the regression model is defined as: y=B1x+u Use the least squares method to estimate…
A:
Q: A multiple regression was estimated using the SEK method and the results are given below. Based on…
A: Multiple linear regression model: A multiple linear regression model is given as y = b0 + b1x1 +…
Q: A linear regression model based on a random sample of 36 observations on the response variable and 4…
A:
Q: Fit these three regression models and then discuss the similarities and differences between them,…
A: Given three regression output for Brand liking with respect to independent variables sweetness,…
Q: True/false (please explain). Suppose that a regression of Y on X₁ is unbiased, and the true slope…
A: From the given scenario, consider Y as response variable and X1, X2 as explanatory variables. The…
Q: State the large-sample distribution of the instrumental variables estimator for the simple linear…
A: Instrumental variable estimators provide a way to obtain consistent parameter estimates. This method…
Show that the maximum likelihood estimation for the error variance oin linear regression is given by:
(see attached)
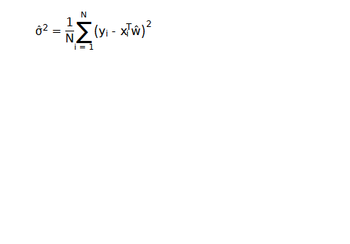
Step by step
Solved in 5 steps with 4 images
Looking at Step 2, I'm really confused. You say and true value of the response variable
- Use RStudio to fit a simple linear regression model to the data below. Please submit a copy of your code and any appropriate output (a photo/screenshot will be sufficient). 300? Is the fitted linear regression model What is the 95% prediction interval for xo = appropriate for this data, and which assumption appears to be violated if not? dataset <- data.frame ( с (294, 247, 267, 358, 423, 311, 450, 534, 438, 688, 630, 709, 627, 1021, 615, 700, 999, 1250, 1015, 850, 980, 1650, 1025, 1200, 1500), у 3 с (30, 32, 37, 44, 47, 49, 56, 62, 68, 80, 84, 88, 97, 97, 100, 106, 109, 112, 117, 128, 130, 135, 160, 180, 210) X = %3DThe image contains two graphs typical of the analysis of a simple linear regression model. It can be stated that: a. The variance of the errors seems constant b. The errors do not come from a normal distribution c. The linear model does not seem appropriate d. The residuals are close to the line and therefore there is normality in the data. Why? ThanksA study was conducted to determine the relationship between starting salaries (RM thousands) for recent statistics graduates and their grade point averages in the major course. A linear regression model was fitted to the data and the estimates regression function was obtained. Part of the computer output for the above analysis is given below: ANOVA Model Sum of df Mean F Sig. Squares Square Regression 147.28 .000 Error 734.9 40.828 Total 6748.2 Coefficients Unstandardized Coefficients Model Sig. Std. B Error Constant GPA -8.42 3.007 3.395 0.2477 -2.48 12.14 0.011 0.000 (a) Complete the ANOVA table (blue boxes). (b) Write down the estimated regression function. Interpret the estimated parameters. (c) Test whether there is a linear association between salaries and grade point average. Use a = 0.05. (d) Determine the coefficient of determination for the model and interpret its meaning.
- A student used multiple regression analysis to study how family spending (y) is influenced by income (x) family size (x2), and addition to savings(x3). The variables y, x1, and x3. The variables y, x1, and x3 are measured in thousands of dollars . The following results were obtained. ANOVA df SS Regression 3 45.9634 Residual 11 2.6218 Total Coefficient Standard Error Intercept 0.0136 X1 0.7992 0.074 X2 0.2280 0.190 X3 -0.5796 0.920 Write out the estimated regression equation for the relationship between the variables. Compute coefficient of determination. What can you say about the strength of this relationship? Carry out a test to determine whether y is significantly related to the independent variables. Use a 5% level of significant. Carry out a test to see if X3 and y are significantly related. Use a 5% level of significanceSuppose that you run a regression of Y, on X, with 110 observations and obtain an estimate for the slope. Your estimate for the standard error of ₁ is 1. You are considering two different hypothesis tests: The first is a one-sided test: Ho: B1-0, Ha: 31>0, a = .05 The second is a two-sided test: Ho: 31-0, Ha: B1 0,a = .05 (a) What values of , would lead you to reject the null hypothesis in the one-sided test? (b) What values of , would lead you to reject the null hypothesis in the one-sided test? (c) What values of would lead you to reject the mill hypothesis in the one-sided test, but not the two-sided test? (d) What values of 3 would lead you to reject the null hypothesis in the two-sided test, but not the one-sided test?Please do not explain, just say the answer like A,B,C,D,
- Suppose that I want to estimate the effect of x₁ on y. Consider the univariate regression line: how to calculate a and b₁ using OLS? y = a + b₁x₁A linear regression model based on a random sample of 36 observations on the response variable and 4 predictors has a multiple coefficient of determination equal to 0.697. What is the value of the adjusted multiple coefficient of determination?Suppose that you perform a hypothesis test for the slope of the population regression line with the null hypothesis H0: β1 = 0 and the alternative hypothesis Ha: β1 ≠ 0. If you reject the null hypothesis, what can you say about the utility of the regression equation for making predictions?
- The accompanying scatterplot shows the relationship between the age of an internet user and the amount of time spent browsing the internet per week (in minutes). The accompanying residual plot is also shown along with the QQ plot of the residuals. Choose the statement that best describes whether the condition for Normality of errors does or does not hold for the linear regression model. Choose the statement that best describes whether the condition for Normality of errors does or does not hold for the linear regression model. A.The residual plot displays a fan shape; therefore the Normality condition is not satisfied.B.The QQ plot mostly follows a straight line; therefore the Normality condition is satisfied.C.The scatterplot shows a negative trend; therefore the Normality condition is satisfied.D.The residual plot shows no trend; therefore the Normality condition is not satisfied.Consider a simple regression Y = B1 + B2 X + u. Suppose we found out that the variance of error term is changing with larger values of X (heteroscedasticity). Show how you overcome the problem of heteroscedasticity by using White’s heteroscedasticity consistent variances (only for variance of the slope estimate). Show and explain.A group of Maternal and Child Health public health practitioners are interested in the relationship between depression and a number of health outcomes. Suppose the research team gathers information on a group of participants, and constructs a multiple linear regression model looking at the relationship between depression and household income dichotomized as above and below the federal poverty line controlling for a number of potential confounders. The following is a computerized output displaying the results of their analysis. Parameter Estimate Standard Error t Value Pr > |t| Intercept 0.2617346843 0.09209917 2.84 0.0046 Income (1/0) -.1962038300 0.04574793 -4.29 <.0001 Race (W or AA) -.0320329506 0.03900447 -0.82 0.4118 bmicontinuous 0.0051185980 0.00216986 2.36 0.0186 Alcohol (Y/N) -.0088735044 0.03090631 -0.29 0.7741 A) What are the independent and dependent variables? B) Which potential…