MATLAB: An Introduction with Applications
6th Edition
ISBN: 9781119256830
Author: Amos Gilat
Publisher: John Wiley & Sons Inc
expand_more
expand_more
format_list_bulleted
Question

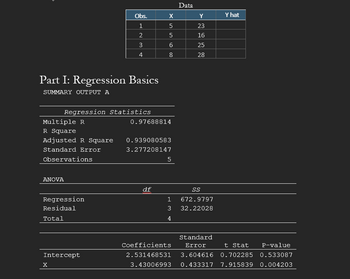
Transcribed Image Text:Part I: Regression Basics
SUMMARY OUTPUT A
Multiple R
R Square
Adjusted R Square
Standard Error
Observations
ANOVA
Regression
Residual
Total
Obs.
1
2
Regression Statistics
Intercept
X
3
4
X5560 00
8
0.97688814
df
0.939080583
3.277208147
5
1
3
4
Data
Y
23
16
25
28
SS
672.9797
32.22028
Y hat
Standard
Error
Coefficients
t Stat P-value
2.531468531 3.604616 0.702285 0.533087
3.43006993 0.433317 7.915839 0.004203
Expert Solution
arrow_forward
Step 1
Data given
Coefficient of intercept=2.531468531
Coefficient of X =3.43006993
Step by stepSolved in 2 steps with 1 images

Knowledge Booster
Similar questions
- 1. What is R2 and the standard error for the regression? 1a. What is your point estimate enrollment for Spring 2022?arrow_forwardUsing the regression model from the previous problem, what is the interpretation of the slope coefficient associated with Age? Assume Salary is measured in $1,000's.arrow_forwardThe data are the ages of criminals and their victims. The regression output is shown in a separate tab from the data. Do the data support that a prediction of victim age can be obtained given the data provided in the file? Cite the elements of the output you used to draw your conclusion.arrow_forward
- Q) Plot the relationship between total operating costs and machine hours. Draw the regression line.arrow_forwardBig Time Corporation wanted to determine the relationship between its monthly operating costs and a potential cost driver, machine hours. The output of a regression analysis showed the following information (note: only a portion of the regression analysis results is presented here) SUMMARY OUTPUT Regression Statistics Multiple R 0.998041188 R Square 0.996086212 Adjusted R Square 0.994781616 Standard Error 917.1714273 Observations 5 ANOVA df SS MS F Significance F Regression 1 642276389.7 642276389.7 763.5208906 0.000104039 Residual 3 2523610.281 841203 427 Total 4 644800000 Coefficients Standard Errort Stat P-value Intercept 6679.617454 931.8558049 7.168080532 0.005592948 3714.03639 X Variable 9.796772265 0.354545968 27.63188178 0.000104039 8.66844876 What is variable cost per machine hour (rounded to the nearest cent)? OA. $6,679.62 OB. $917.17 OC. $9.80 OD. $.99 Lower 95% Upper 95.0% 9645.198517 10.92509577arrow_forwardA researcher's results are shown below using Femlab(labor force participation rate among females) to try to predict Cancer (death rate per 100,000 population due to cancer) in the 50 US states. What is the R2 for this regression? Source of variation df ss ms f Regression 1 5377.836 5377.836 5.228879 residual 48 49367.389 1028.487 total 49 54745.225arrow_forward
- Please fill in the blanks and select the correct answers over the image provided. Thank youarrow_forwardThe parallel trends assumption is a crucial assumption for which the following estimators? Multiple regression Differences-in-Differences First differences Instrumental Variablearrow_forwardUsing the regression model from the previous problem, what is the interpretation of the slope coefficient associated with Age? Assume Salary is measured in $1,000's.arrow_forward
- We will _______ if the test statistic lands in the unlikely region. Group of answer choices A. reject the alternative hypothesis B. fail to reject the null hypothesis C. cannot determine D. reject the null hypothesis and accept the alternative hypothesisarrow_forwardWhat is the least-squares regression line with the point (9,13) included in the data set? Data Set x y 3 6 4 5 5 7 7 6 8 9 8 8 10 8 11 9 11 7 12 10 13 12 13 10 14 11 This is a reading assessment question. ..... y hat = ______x + ______ Type integers or decimals rounded to 4 decimal places as neededarrow_forwardWhat is a residual for a multiple regression model and the data that is used to create it? Select one. Question 3 options: A statistic that explains the relationship between response and predictor variables The predicted value of the response variable using the multiple regression model A statistic that is used to evaluate the significance of the multiple regression model The difference between the actual value of the response variable and the corresponding predicted value (regression error) using the multiple regression modelarrow_forward
arrow_back_ios
SEE MORE QUESTIONS
arrow_forward_ios
Recommended textbooks for you
 MATLAB: An Introduction with ApplicationsStatisticsISBN:9781119256830Author:Amos GilatPublisher:John Wiley & Sons Inc
 Probability and Statistics for Engineering and th...StatisticsISBN:9781305251809Author:Jay L. DevorePublisher:Cengage Learning
 Statistics for The Behavioral Sciences (MindTap C...StatisticsISBN:9781305504912Author:Frederick J Gravetter, Larry B. WallnauPublisher:Cengage Learning
 Elementary Statistics: Picturing the World (7th E...StatisticsISBN:9780134683416Author:Ron Larson, Betsy FarberPublisher:PEARSON
 The Basic Practice of StatisticsStatisticsISBN:9781319042578Author:David S. Moore, William I. Notz, Michael A. FlignerPublisher:W. H. Freeman
 Introduction to the Practice of StatisticsStatisticsISBN:9781319013387Author:David S. Moore, George P. McCabe, Bruce A. CraigPublisher:W. H. Freeman

MATLAB: An Introduction with Applications
Statistics
ISBN:9781119256830
Author:Amos Gilat
Publisher:John Wiley & Sons Inc

Probability and Statistics for Engineering and th...
Statistics
ISBN:9781305251809
Author:Jay L. Devore
Publisher:Cengage Learning

Statistics for The Behavioral Sciences (MindTap C...
Statistics
ISBN:9781305504912
Author:Frederick J Gravetter, Larry B. Wallnau
Publisher:Cengage Learning

Elementary Statistics: Picturing the World (7th E...
Statistics
ISBN:9780134683416
Author:Ron Larson, Betsy Farber
Publisher:PEARSON

The Basic Practice of Statistics
Statistics
ISBN:9781319042578
Author:David S. Moore, William I. Notz, Michael A. Fligner
Publisher:W. H. Freeman

Introduction to the Practice of Statistics
Statistics
ISBN:9781319013387
Author:David S. Moore, George P. McCabe, Bruce A. Craig
Publisher:W. H. Freeman