MATLAB: An Introduction with Applications
6th Edition
ISBN: 9781119256830
Author: Amos Gilat
Publisher: John Wiley & Sons Inc
expand_more
expand_more
format_list_bulleted
Question

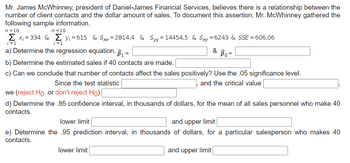
Transcribed Image Text:Mr. James McWhinney, president of Daniel-James Financial Services, believes there is a relationship between the
number of client contacts and the dollar amount of sales. To document this assertion, Mr. McWhinney gathered the
following sample information.
n = 10
n=10
Σ x₁ = 334 & Σ y₁=615 & Sxx=2814.4 & Syy=14454.5 & Sxy=6243 & SSE =606.06
i=1
i=1
a) Determine the regression equation. ₁ =
b) Determine the estimated sales if 40 contacts are made.
& Bo
=
c) Can we conclude that number of contacts affect the sales positively? Use the .05 significance level.
Since the test statistic
and the critical value
we (reject Ho or don't reject Ho)
d) Determine the .95 confidence interval, in thousands of dollars, for the mean of all sales personnel who make 40
contacts.
lower limit
lower limit
and upper limit
e) Determine the .95 prediction interval, in thousands of dollars, for a particular salesperson who makes 40
contacts.
and upper limit
Expert Solution
This question has been solved!
Explore an expertly crafted, step-by-step solution for a thorough understanding of key concepts.
Step by stepSolved in 5 steps with 15 images

Knowledge Booster
Similar questions
- In this problem, assume that the distribution of differences is approximately normal. Note: For degrees of freedom d.f. not in the Student's t table, use the closest d.f. that is smaller. In some situations, this choice of d.f. may increase the P-value by a small amount and therefore produce a slightly more "conservative" answer.arrow_forwardA student wishes to determine the average life-span of a household light bulb. She randomly collects 15 light bulbs. The issue that may arise from her survey is… The bias will be high. The accuracy will be low. The precision will be low. The standard error will be too low.arrow_forwardPlease answer 4.6arrow_forward
- Suppose we want to test whether or not the average SAT score at the University of Seychelles is significantly larger than the average SAT score at Vermont. Taking a random sample, we manage to get the following seven scores from Vermont students: Vermont: 1340 1500 1430 1440 1380 1470 1290 and the following nine scores from Seychelles students: Seychelles: 1540 1480 1390 1450 1440 1350 1520 1400 1600 Assuming that the standard deviation in SAT scores for students at Seychelles and Vermont is the same and equal to 77 points, test at the α=:05 significance level whether or not the average SAT score atthe University of Seychelles is larger than the average SAT score at Vermont.arrow_forwardb.arrow_forwardSuppose that 50 measurements were taken and the mean was calculated to be 4.55. Assume next that one of the data items was 19.4This was assumed to be an outlier as was discarded. What would be the mean of the remaining 49 numbers? Iarrow_forward
- The city of Hampton is surveying households to see if the number of cats per household has changed over the past decade. The last known average of cats per household was 1.08. What statistical procedure should you use to analyze these data? O one sample z test Oone sample t test O correlated groups t test O independent groups t testarrow_forward2) Now read the following data into R. Use R for all statistical procedures. Use R studio for the test.Sample Sample A B0.7969 1.4731 1.2669 3.2137 1.5856 2.2486 0.4959 1.1156 0.5022 10.6207 0.5524 1.983510.3060 31.2243 0.6244 3.7984 1.9789 1.4710 1.6788 9.0351(a) Make q-q plots of both samples. (b) Perform a t-test (Welch's test). (c) Perform a MWU test. (d) Which test gave you the better p-value now? Why? (e) What is a “better” p-value? Why? (f) This is two sided - why?arrow_forwardA. For which data set is the sample correlation coefficient r closest to −1? B. For which data set is the sample correlation coefficient r closest to 0? C. For which data set is the sample correlation coefficient r equal to 1?arrow_forward
arrow_back_ios
arrow_forward_ios
Recommended textbooks for you
 MATLAB: An Introduction with ApplicationsStatisticsISBN:9781119256830Author:Amos GilatPublisher:John Wiley & Sons Inc
 Probability and Statistics for Engineering and th...StatisticsISBN:9781305251809Author:Jay L. DevorePublisher:Cengage Learning
 Statistics for The Behavioral Sciences (MindTap C...StatisticsISBN:9781305504912Author:Frederick J Gravetter, Larry B. WallnauPublisher:Cengage Learning
 Elementary Statistics: Picturing the World (7th E...StatisticsISBN:9780134683416Author:Ron Larson, Betsy FarberPublisher:PEARSON
 The Basic Practice of StatisticsStatisticsISBN:9781319042578Author:David S. Moore, William I. Notz, Michael A. FlignerPublisher:W. H. Freeman
 Introduction to the Practice of StatisticsStatisticsISBN:9781319013387Author:David S. Moore, George P. McCabe, Bruce A. CraigPublisher:W. H. Freeman

MATLAB: An Introduction with Applications
Statistics
ISBN:9781119256830
Author:Amos Gilat
Publisher:John Wiley & Sons Inc

Probability and Statistics for Engineering and th...
Statistics
ISBN:9781305251809
Author:Jay L. Devore
Publisher:Cengage Learning

Statistics for The Behavioral Sciences (MindTap C...
Statistics
ISBN:9781305504912
Author:Frederick J Gravetter, Larry B. Wallnau
Publisher:Cengage Learning

Elementary Statistics: Picturing the World (7th E...
Statistics
ISBN:9780134683416
Author:Ron Larson, Betsy Farber
Publisher:PEARSON

The Basic Practice of Statistics
Statistics
ISBN:9781319042578
Author:David S. Moore, William I. Notz, Michael A. Fligner
Publisher:W. H. Freeman

Introduction to the Practice of Statistics
Statistics
ISBN:9781319013387
Author:David S. Moore, George P. McCabe, Bruce A. Craig
Publisher:W. H. Freeman