
MATLAB: An Introduction with Applications
6th Edition
ISBN: 9781119256830
Author: Amos Gilat
Publisher: John Wiley & Sons Inc
expand_more
expand_more
format_list_bulleted
Related questions
Question
I use TI-nspire cx I do not know what or how to write this to calculator to find out the median and mode
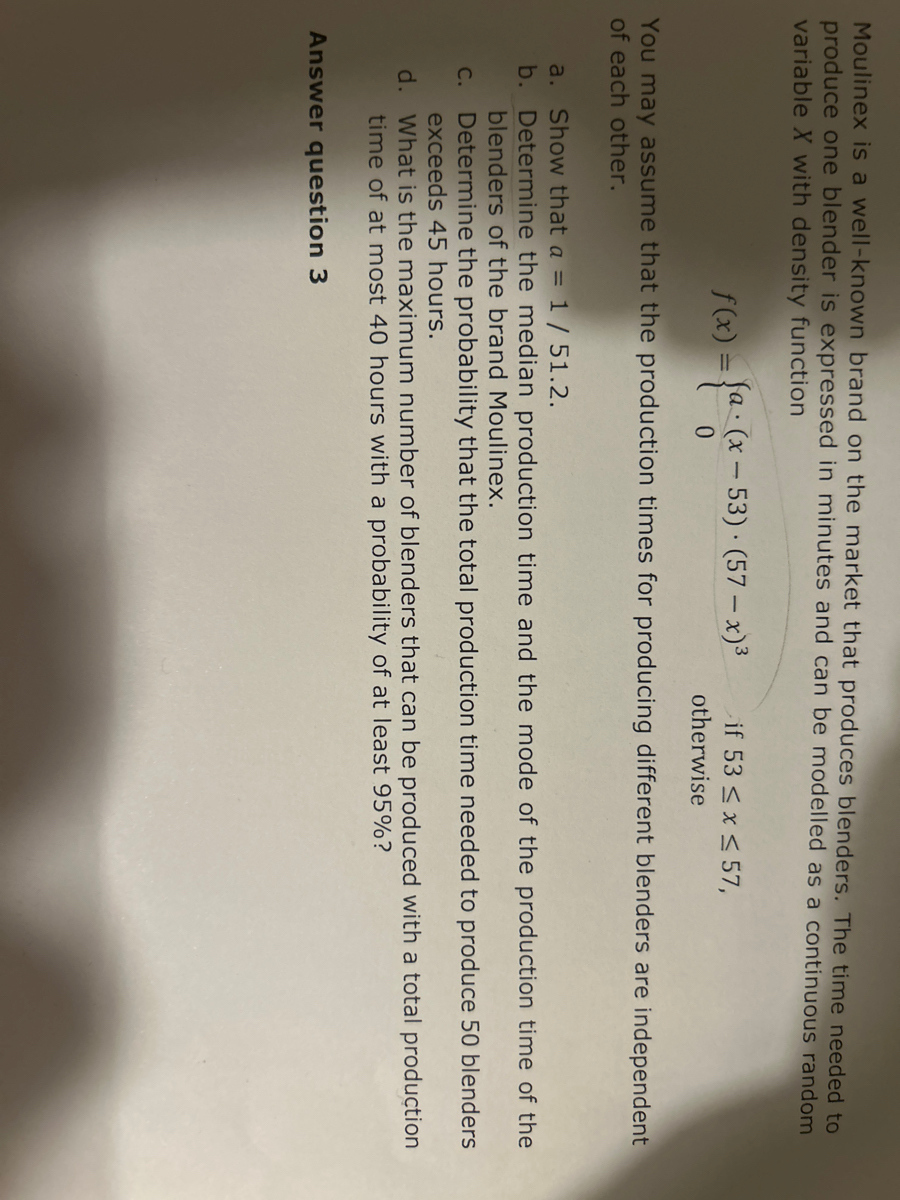

Transcribed Image Text:Moulinex is a well-known brand on the market that produces blenders. The time needed to
produce one blender is expressed in minutes and can be modelled as a continuous random
variable X with density function
f(x) = {a-(x - 53) - (57-x)³
0
if 53 ≤ x ≤ 57,
otherwise
You may assume that the production times for producing different blenders are independent
of each other.
a. Show that a = 1 / 51.2.
b. Determine the median production time and the mode of the production time of the
blenders of the brand Moulinex.
c.
Determine the probability that the total production time needed to produce 50 blenders
exceeds 45 hours.
d.
What is the maximum number of blenders that can be produced with a total production
time of at most 40 hours with a probability of at least 95%?
Answer question 3
Expert Solution
This question has been solved!
Explore an expertly crafted, step-by-step solution for a thorough understanding of key concepts.

Step by stepSolved in 3 steps with 4 images

Knowledge Booster

Similar questions
- For the question above, can you calculate the Median, Q3, P45 and range with work shown? Thanksarrow_forwardGive an example of a set of data that might be better represented by the median than the mean. Explain why.arrow_forwardGeneral Social Survey (GSS) 2006 collected the data of the number of people in each household in the U.S. The variable name is "hompop."arrow_forward
- Please solve with the full step and no reject thank uarrow_forwardThe list shows the score of each game completed at a bowling alley during a one-hour period. 90, 96, 120, 124, 130, 135, 138, 140, 145, 148, 290, 290 Would the mode of the data be an informative measure of center in this situation? Explain your answer.arrow_forwardA pediatrician records the age x (in yr) and average height y (in inches) for girls between the ages of 2 and 10. Height of Girls vs. Age 50- 40- (4,38) 30- 10- 0 Age(yr) Part: 0 / 4 Part 1 of 4 (a) Use the points (4, 38) and (8, 50) to write a linear model for these data. X y = Skip Part Check Height (in.) (8,50) Ⓒ2022 McGraw Hill LLC. All Rights Reserve Aarrow_forward
- find mode of the data 2,3,4,5,6,7,7,6,5,5,5,4,2,1,0,10,77,88,arrow_forwardS X h & B... hegartymaths.com/assessment + proud heather smal... ▸ One Day- Matisyah... a = | b = Use the table to work out the values of a, b, c, and d. C= X 3 2 -1 1 2 d = y = 2x + 1 a Email - Chloe Kosky... b -3 1 C darrow_forward
arrow_back_ios
arrow_forward_ios
Recommended textbooks for you
- MATLAB: An Introduction with ApplicationsStatisticsISBN:9781119256830Author:Amos GilatPublisher:John Wiley & Sons Inc
 Probability and Statistics for Engineering and th...StatisticsISBN:9781305251809Author:Jay L. DevorePublisher:Cengage Learning
 Statistics for The Behavioral Sciences (MindTap C...StatisticsISBN:9781305504912Author:Frederick J Gravetter, Larry B. WallnauPublisher:Cengage Learning
  Elementary Statistics: Picturing the World (7th E...StatisticsISBN:9780134683416Author:Ron Larson, Betsy FarberPublisher:PEARSON
 The Basic Practice of StatisticsStatisticsISBN:9781319042578Author:David S. Moore, William I. Notz, Michael A. FlignerPublisher:W. H. Freeman
 Introduction to the Practice of StatisticsStatisticsISBN:9781319013387Author:David S. Moore, George P. McCabe, Bruce A. CraigPublisher:W. H. Freeman
MATLAB: An Introduction with Applications
Statistics
ISBN:9781119256830
Author:Amos Gilat
Publisher:John Wiley & Sons Inc
Probability and Statistics for Engineering and th...
Statistics
ISBN:9781305251809
Author:Jay L. Devore
Publisher:Cengage Learning
Statistics for The Behavioral Sciences (MindTap C...
Statistics
ISBN:9781305504912
Author:Frederick J Gravetter, Larry B. Wallnau
Publisher:Cengage Learning
Elementary Statistics: Picturing the World (7th E...
Statistics
ISBN:9780134683416
Author:Ron Larson, Betsy Farber
Publisher:PEARSON
The Basic Practice of Statistics
Statistics
ISBN:9781319042578
Author:David S. Moore, William I. Notz, Michael A. Fligner
Publisher:W. H. Freeman
Introduction to the Practice of Statistics
Statistics
ISBN:9781319013387
Author:David S. Moore, George P. McCabe, Bruce A. Craig
Publisher:W. H. Freeman