A First Course in Probability (10th Edition)
10th Edition
ISBN: 9780134753119
Author: Sheldon Ross
Publisher: PEARSON
expand_more
expand_more
format_list_bulleted
Question

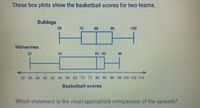
Transcribed Image Text:### Basketball Scores Comparison
This image presents box plots comparing the basketball scores for two teams: the Bulldogs and the Wolverines.
#### Box Plot Explanation
- **Bulldogs:**
- Minimum score: 55
- First quartile (Q1): 70
- Median (Q2): 80
- Third quartile (Q3): 90
- Maximum score: 105
- **Wolverines:**
- Minimum score: 35
- First quartile (Q1): 55
- Median (Q2): 80
- Third quartile (Q3): 85
- Maximum score: 95
The box plots have a horizontal axis labeled "Basketball scores," ranging from 30 to 110. Each plot shows:
- A line extending from the minimum to the maximum values
- A box spanning from the first quartile to the third quartile
- A line within the box representing the median.
#### Analysis Question
Below the box plots is a question:
**"Which statement is the most appropriate comparison of the spreads?"**
This invites analysis of the variability and distribution range between the two teams' scores. The Bulldogs have a wider spread of scores, while the Wolverines' scores are more concentrated.

Transcribed Image Text:**Transcription for Educational Website: Data Analysis Practice**
This section presents a multiple-choice question designed to test your understanding of statistical concepts like median, interquartile range, and range.
---
**Options:**
- **A.** The median for the Bulldogs, 80, is the same as the median for the Wolverines, 80.
- **B.** The interquartile ranges (IQRs) for the Bulldogs and Wolverines are both 80.
- **C.** The interquartile range (IQR) for the Bulldogs, 20, is less than the IQR for the Wolverines, 30.
- **D.** The range for the Bulldogs, 20, is less than the range for the Wolverines, 30.
---
**Instructions:** Analyze each statement carefully, using your knowledge of the measures of central tendency and spread, to determine which statement accurately represents the data between the Bulldogs and Wolverines.
Expert Solution
This question has been solved!
Explore an expertly crafted, step-by-step solution for a thorough understanding of key concepts.
This is a popular solution
Trending nowThis is a popular solution!
Step by stepSolved in 2 steps

Knowledge Booster
Similar questions
- Use the box-and-whisker plot to identify the five-number summary. 940 2081 1205 1477 1957 900 1200 1500 1800 2100arrow_forwardStudents in a statistics class took their first test. The following are the scores they earned. Fill in the stem-and-leaf plot below use the tens place as the stem and the ones place as the leaf. Describe the shape of the distribution. 73 84 95 91 98 97 90 74 74 82 63 79 82 88 74 88 67 81 83 69 73 95 91 94 86 56 94 62 a) Data were collected for variable(s). Is it appropriate to make a stem-and-leaf plot for this type of data and number of variables? . b) Complete the stem-and-leaf plot below. You must put commas between the leaves. Stems Leaves 5 c) What shape is the stem-and-leaf plot above?arrow_forwardHere is a data set: 24 18 21 32 21 29 29 35 20 39 31 18 20 18 28 22 26 22 34 34 You are examining the data with a split stem-and-leaf plot. Here is the start of the plot: 1 | 888 2 | 0011224 2 | 6899 31 3 | What should be entered in the second to last row of this table? 31 Question Help:Video Message instructorarrow_forward
- A high school has 44 players on the football team. The summary of the players' weights is given in the box plot. Approximately, what is the percentage of players weighing greater than or equal to 234 pounds? 166 203 234 154 256 - 0o 150 160 170 180 | 190 200 210 220 230 240 250 260 270 00 Weight (in pounds)arrow_forwardPlease help 11 and 12arrow_forwardPlease give me answer immediately.arrow_forward
- What fraction of the numbers in the data set is greater than the median? 10 12 14 16 16 16 16 16 21 25 27 39arrow_forwardAn instructor is wondering if students who spend more time taking their final exam do better than those who take less time. The following data is gathered. Minutes 57 47 36 83 86 117 87 62 87 86 68 106 95 72 95 Score 96 92 92 77 96 96 81 85 88 96 70 81 77 74 77 What is the coefficient of determination? Multiple Choice −0.128 0.016 0.651 −0.053arrow_forwardL4Q2.Which one of the following scatter plots best describes the given data?arrow_forward
- Males 74 75 69 72 75 73 88 76 71 64 67 71 72 82 71 83 82 78 80 81 75 Females 75 57 61 71 79 78 81 65 57 80 73 83 86 79 65 70 69 76 55 66 79 5. Construct stem-and-leaf plots for each data set using four stems. You should have two separate plots: one for men and one for women. 6. Why is it important to have the same stems for both plots, even though one plot has an empty stem? 7. Comment on the distributions. What type on conclusions can you make about the heart rates of males and females? Do they appear to be very different?arrow_forwardfind the 5 number summary and construct a box plot for company Aarrow_forwardDraw a scatter plot for the data in the following table. -4 -3 -2 -1 0 1 2 3 4 LO y 0.5 3 4.8 6 7.1 7.2 8.3 8.9 9 9.9 9 8 7 6 5 4 3 21 + -4-3 -2 -1 1 2 3 4 5 Clear All Draw: Dotarrow_forward
arrow_back_ios
SEE MORE QUESTIONS
arrow_forward_ios
Recommended textbooks for you
 A First Course in Probability (10th Edition)ProbabilityISBN:9780134753119Author:Sheldon RossPublisher:PEARSON

A First Course in Probability (10th Edition)
Probability
ISBN:9780134753119
Author:Sheldon Ross
Publisher:PEARSON
