
MATLAB: An Introduction with Applications
6th Edition
ISBN: 9781119256830
Author: Amos Gilat
Publisher: John Wiley & Sons Inc
expand_more
expand_more
format_list_bulleted
Related questions
Question
thumb_up100%
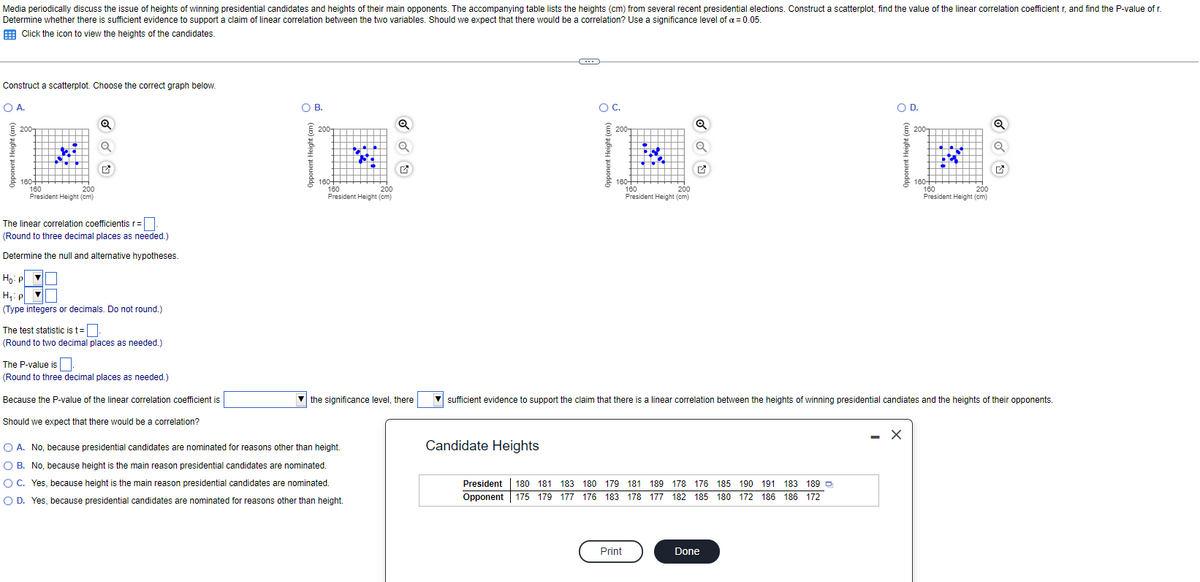

Transcribed Image Text:The text discusses the analysis of the heights of winning presidential candidates compared to their main opponents. The task involves constructing a scatterplot from the given height data to determine any linear correlation between the two variables: the height of the winning candidate and the height of their opponents. The significance level is set at α = 0.05.
### Steps to Perform the Analysis:
1. **Construct a Scatterplot**:
- Choose the correct graph from options A, B, C, or D. Each graph plots the opponent's height (y-axis) against the president’s height (x-axis).
2. **Calculate the Linear Correlation Coefficient (r)**:
- Input the value of \( r \) and round to three decimal places.
3. **Formulate Hypotheses**:
- Null Hypothesis (H₀): \( \rho = 0 \)
- Alternative Hypothesis (H₁): \( \rho \neq 0 \)
4. **Determine the Test Statistic (t)**:
- Input the test statistic value and round to two decimal places.
5. **Identify the P-Value**:
- Input the P-value of the test and round to three decimal places.
6. **Decision Rule**:
- Compare the P-value with the significance level to decide whether there is sufficient evidence for a linear correlation.
7. **Interpretation of Results**:
- Discuss whether the model expects a correlation, considering whether height is a factor in presidential candidate nomination.
### Candidate Heights Data:
- **President Heights (cm)**: 180, 181, 183, 180, 179, 181, 179, 176, 185, 190, 191, 183, 189
- **Opponent Heights (cm)**: 175, 179, 177, 176, 177, 185, 180, 172, 186, 186, 172
### Conclusion Options for Correlation Expectation:
A. No, because presidential candidates are nominated for reasons other than height.
B. No, because height is the main reason presidential candidates are nominated.
C. Yes, because height is the main reason presidential candidates are nominated.
D. Yes, because presidential candidates are nominated for reasons other than height.
Through this exercise, learners will understand how to analyze data for correlation using scatterplots, calculate correlation coefficients, and make inferences using statistical tests.
Expert Solution
This question has been solved!
Explore an expertly crafted, step-by-step solution for a thorough understanding of key concepts.

This is a popular solution

Trending nowThis is a popular solution!

Step by stepSolved in 3 steps with 3 images

Knowledge Booster

Similar questions
- The data shown below consists of the price (in dollars) of 7 events at a local venue and the number of people who attended. Determine if there is significant linear correlation between ticket price and number of attendees. Use a significance level of 0.01 and round all values to 4 decimal places. Ticket Price 6 10 14 18 22 26 30 r= Ho: p= 0 Ha: p=0 Find the Linear Correlation Coefficient Find the p-value p-value= Attendence 151 146 146 145 The p-value is 138 137 137 O Less than (or equal to) a O Greater than a The p-value leads to a decision to Accept Ho Reject Ho Do Not Reject Ho The conclusion is There is insufficient evidence to make a conclusion about the linear correlation between ticket price and attendance. There is a significant negative linear correlation between ticket price and attendance. There is a significant positive linear correlation between ticket price and attendance. There is a significant linear correlation between ticket price and attendance.arrow_forward8zzzzzarrow_forwardPolice sometimes measure shoe prints at crime scenes so that they can learn something about criminals. Listed below are shoe print lengths, foot lengths, and heights of males. Construct a scatterplot, find the value of the linear correlation coefficient r, and find the P-value of r. Determine whether there is sufficient evidence to support a claim of linear correlation between the two variables. Based on these results, does it appear that police can use a shoe print length to estimate the height of a male? Use a significance level of α=0.01. Shoe Print (cm) 29.0 29.0 31.2 31.7 27.1 Foot Length (cm) 26.3 24.9 28.0 26.0 25.7 Height (cm) 177.5 173.1 181.1 181.6 176.9arrow_forward
- Listed below are amounts of bills for dinner and the amounts of the tips that were left. Construct a scatterplot, find the value of the linear correlation coefficient r, and find the P-value of r. Determine whether there is sufficient evidence to support a claim of linear correlation between the two variables. Use a significance level of α=0.01. If everyone were to tip with the same percentage, what should be the value of r? Bill (dollars) 34.14 47.51 85.27 88.36 66.73 105.33 Tip (dollars) 3.51 5.55 16.44 17.42 6.69 13.97arrow_forwardThe data shown below consists of the price (in dollars) of 7 events at a local venue and the number of people who attended. Determine if there is significant linear correlation between ticket price and number of attendees. Use a significance level of 0.01 and round all values to 4 decimal places. Ticket Price Attendence 6 170 10 151 14 171 18 160 22 172 26 179 30 130 Но: р %3D 0 Ha: p = 0 Find the Linear Correlation Coefficient Find the p-value p-value = The p-value is O Less than (or equal to) a O Greater than aarrow_forwardListed below are amounts of bills for dinner and the amounts of the tips that were left. Construct a scatterplot, find the value of the linear correlation coefficient r, and find the P-value of r. Determine whether there is sufficient evidence to support a claim of linear correlation between the two variables. Use a significance level of a = 0.01. If everyone were to tip with the same percentage, what should be the value of r? Bill (dollars) Tip (dollars) 31.80 52.94 85.82 102.16 60.17 111.77 D 5.46 6.07 15.82 15.40 11.15 20.32 Construct a scatterplot. Choose the correct graph below. O A. O B. Oc. D. Q 25- 25- 25 0- 30 0- 30 Bill Amount ($) 0+ 30 Bill Amount (S) 0- 30 Bill Amount (S) 120 120 120 Bill Amount (S) 120 The linear correlation coefficient is r= 0.954 (Round to three decimal places as needed.) Determine the null and alternative hypotheses. Ho: p H,: P (Type integers or decimals. Do not round.) Tip Amount ($) ip Amount ($) Tip Amount ($) Tip Amount ($)arrow_forward
- Police sometimes measure shoe prints at crime scenes so that they can learn something about criminals. Listed below are shoe print lengths, foot lengths, and heights of males. Construct a scatterplot, find the value of the linear correlation coefficient r, and find the P-value of r. Determine whether there is sufficient evidence to support a claim of linear correlation between the two variables. Based on these results, does it appear that police can use a shoe print length to estimate the height of a male? Use a significance level of a=0.05. Shoe Print (cm) 28.8 28.8. 32.1 32.6 Foot Length (cm) Height (cm) 25.2 181.7 24.9 173.5 27.5 27.6 27.5 25.9 186 169.1 171 Construct a scatterplot. Choose the correct graph below. OA. 200- 2 160+ Shoe Print (cm) 35 The linear correlation coefficient is r= (Round to three decimal places as needed.) B. 200- 160- 25 Shoe Print (cm) ○ C. 200- G 35 160+ 25 Shoe Print (cm) 35 OD. Q 200- Height (cm) G 160- 25 35 Shoe Print (cm)arrow_forwardThe accompanying table lists the ages of acting award winners matched by the years in which the awards were won. Construct a scatterplot, find the value of the linear correlation coefficient r, and find the P-value of r. Determine whether there is sufficient evidence to support a claim of linear correlation between the two variables. Should we expect that there would be a correlation? Use a significance level of α=0.05. Best Actress - Best Actor 27 - 41 30 - 35 29 - 36 61 - 45 31 - 52 34 - 46 45 - 62 30 - 52 60 - 38 23 - 52 44 - 44 52 - 32 what is the linear coefficient?arrow_forwardfind linear correlation coefficient, P value, and test statistic.arrow_forward
- Listed below are the amounts of bills for dinner and the amounts of the tips that were left. Construct a scatterplot, find the value of the linear correlation coefficient r, and find the P-value of r. Determine whether there is sufficient evidence to support a claim of linear correlation between the two variables. Use a significance level of α=0.01. If everyone were to tip with the same percentage, what should be the value of r? Bill (dollars) 31.65 53.83 87.10 103.64 60.34 109.80 Tip (dollars) 3.74 5.76 14.73 16.86 7.44 20.73 1. The linear correlation coefficient is r= 2. What are the null and alternative hypotheses? 3. The test statistic is t= 4. The P-Value is P=arrow_forwardThe accompanying table lists the ages of acting award winners matched by the years in which the awards were won. Construct a scatterplot, find the value of the linear correlation coefficient r, and find the P-value of r. Determine whether there is sufficient evidence to support a claim of linear correlation between the two variables. Should we expect that there would be a correlation? Use a significance level of α=0.05. LOADING... Click the icon to view the ages of the award winners. Construct a scatterplot. Choose the correct graph below. A. 20702070Best Actress (years)Best Actor (years) A scatterplot has a horizontal axis labeled Best Actress in years from 20 to 70 in increments of 5 and a vertical axis labeled Best Actor in years from 20 to 70 in increments of 5. Twelve points are plotted. Eleven of the plotted points follow the pattern of a line rising from left to right passing through the points (24, 38) and (66, 58). An…arrow_forwardThanks!arrow_forward
arrow_back_ios
SEE MORE QUESTIONS
arrow_forward_ios
Recommended textbooks for you
- MATLAB: An Introduction with ApplicationsStatisticsISBN:9781119256830Author:Amos GilatPublisher:John Wiley & Sons Inc
 Probability and Statistics for Engineering and th...StatisticsISBN:9781305251809Author:Jay L. DevorePublisher:Cengage Learning
 Statistics for The Behavioral Sciences (MindTap C...StatisticsISBN:9781305504912Author:Frederick J Gravetter, Larry B. WallnauPublisher:Cengage Learning
  Elementary Statistics: Picturing the World (7th E...StatisticsISBN:9780134683416Author:Ron Larson, Betsy FarberPublisher:PEARSON
 The Basic Practice of StatisticsStatisticsISBN:9781319042578Author:David S. Moore, William I. Notz, Michael A. FlignerPublisher:W. H. Freeman
 Introduction to the Practice of StatisticsStatisticsISBN:9781319013387Author:David S. Moore, George P. McCabe, Bruce A. CraigPublisher:W. H. Freeman
MATLAB: An Introduction with Applications
Statistics
ISBN:9781119256830
Author:Amos Gilat
Publisher:John Wiley & Sons Inc
Probability and Statistics for Engineering and th...
Statistics
ISBN:9781305251809
Author:Jay L. Devore
Publisher:Cengage Learning
Statistics for The Behavioral Sciences (MindTap C...
Statistics
ISBN:9781305504912
Author:Frederick J Gravetter, Larry B. Wallnau
Publisher:Cengage Learning
Elementary Statistics: Picturing the World (7th E...
Statistics
ISBN:9780134683416
Author:Ron Larson, Betsy Farber
Publisher:PEARSON
The Basic Practice of Statistics
Statistics
ISBN:9781319042578
Author:David S. Moore, William I. Notz, Michael A. Fligner
Publisher:W. H. Freeman
Introduction to the Practice of Statistics
Statistics
ISBN:9781319013387
Author:David S. Moore, George P. McCabe, Bruce A. Craig
Publisher:W. H. Freeman