
MATLAB: An Introduction with Applications
6th Edition
ISBN: 9781119256830
Author: Amos Gilat
Publisher: John Wiley & Sons Inc
expand_more
expand_more
format_list_bulleted
Related questions
Concept explainers
Topic Video
Question
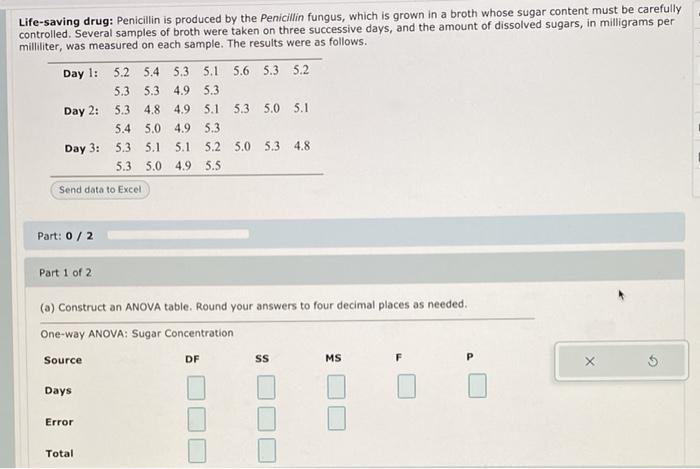

Transcribed Image Text:Life-saving drug: Penicillin is produced by the Penicillin fungus, which is grown in a broth whose sugar content must be carefully
controlled. Several samples of broth were taken on three successive days, and the amount of dissolved sugars, in milligrams per
milliliter, was measured on each sample. The results were as follows.
Day 1: 5.2 5.4 5.3 5.1
5.3 5.3
5.6 5.3 5.2
4.9 5.3
Day 2:
5.3
4.8 4.9 5.1
5.3 5.0 5.1
5.4 5.0 4.9 5.3
Day 3: 5.3 5.1
5.1
5.2 5.0 5.3 4.8
5.3 5.0
4.9
5.5
Send data to Excel
Part: 0/2
Part 1 of 2
(a) Construct an ANOVA table. Round your answers to four decimal places as needed.
One-way ANOVA: Sugar Concentration
Source
DF
MS
F
Days
Error
Total
Expert Solution
This question has been solved!
Explore an expertly crafted, step-by-step solution for a thorough understanding of key concepts.

Step by stepSolved in 2 steps

Knowledge Booster


Learn more about
Need a deep-dive on the concept behind this application? Look no further. Learn more about this topic, statistics and related others by exploring similar questions and additional content below.Similar questions
- Below is a sample quantitative data set. 457.8 386.6 302.3 399.5 425.7 293.9 392.2 459.1 416.9 387.4 388.4 414.1 431.9 374 480.6 481.4 401 401 420.9 439.4 439.4 383.9 291.4 484.6 352 383.7 382.5 514.5 383.7 431.2 386.3 420 386.9 422.4 409 344.3 369.1 503.5 511.4 315.1 383.7 326.3 431 392 291.3 a. Find the first quartile for this data set. Q₁ = b. Find the third quartile for this data set. Q3 = 474.9 400.7 516.5 439.4 517.4 386.2 433 289 467.4 c. Find the interquartile range for this data set. IQR =arrow_forwardGiven the sample data {1, 1, 3, 4, 6}.Calculate the mean.Calculate the standard deviation.arrow_forwardConstruct a quantile graph. Explain why or why not the data set provided has a normal distribution: 5.5, 6.0, 6.4, 5.7, 7.5, 4.5, 5.5, 5.6, 6.5, 6.0, 5.0, and 6.0. include the graph and response.arrow_forward
- Find the estimated standard error for the sample mean for n = 13 and SS = 3639. Nearest hundredths place.arrow_forwardSuppose six pet food stores in the area were surveyed, and the following data shows how many types of pet food each of them carries. 7,7,9, 9, 11, 11 Calculate the sample mean and the sample standard deviation. Round your answers to three decimal places. T = Number Number S=arrow_forward
arrow_back_ios
arrow_forward_ios
Recommended textbooks for you
- MATLAB: An Introduction with ApplicationsStatisticsISBN:9781119256830Author:Amos GilatPublisher:John Wiley & Sons Inc
 Probability and Statistics for Engineering and th...StatisticsISBN:9781305251809Author:Jay L. DevorePublisher:Cengage Learning
 Statistics for The Behavioral Sciences (MindTap C...StatisticsISBN:9781305504912Author:Frederick J Gravetter, Larry B. WallnauPublisher:Cengage Learning
  Elementary Statistics: Picturing the World (7th E...StatisticsISBN:9780134683416Author:Ron Larson, Betsy FarberPublisher:PEARSON
 The Basic Practice of StatisticsStatisticsISBN:9781319042578Author:David S. Moore, William I. Notz, Michael A. FlignerPublisher:W. H. Freeman
 Introduction to the Practice of StatisticsStatisticsISBN:9781319013387Author:David S. Moore, George P. McCabe, Bruce A. CraigPublisher:W. H. Freeman
MATLAB: An Introduction with Applications
Statistics
ISBN:9781119256830
Author:Amos Gilat
Publisher:John Wiley & Sons Inc
Probability and Statistics for Engineering and th...
Statistics
ISBN:9781305251809
Author:Jay L. Devore
Publisher:Cengage Learning
Statistics for The Behavioral Sciences (MindTap C...
Statistics
ISBN:9781305504912
Author:Frederick J Gravetter, Larry B. Wallnau
Publisher:Cengage Learning
Elementary Statistics: Picturing the World (7th E...
Statistics
ISBN:9780134683416
Author:Ron Larson, Betsy Farber
Publisher:PEARSON
The Basic Practice of Statistics
Statistics
ISBN:9781319042578
Author:David S. Moore, William I. Notz, Michael A. Fligner
Publisher:W. H. Freeman
Introduction to the Practice of Statistics
Statistics
ISBN:9781319013387
Author:David S. Moore, George P. McCabe, Bruce A. Craig
Publisher:W. H. Freeman