FINANCIAL ACCOUNTING
10th Edition
ISBN: 9781259964947
Author: Libby
Publisher: MCG
expand_more
expand_more
format_list_bulleted
Question

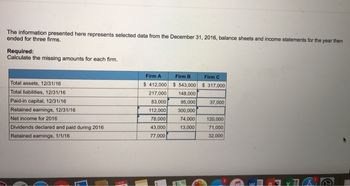
Transcribed Image Text:The information presented here represents selected data from the December 31, 2016, balance sheets and income statements for the year then
ended for three firms.
Required:
Calculate the missing amounts for each firm.
Total assets, 12/31/16
Total liabilities, 12/31/16
Paid-in capital, 12/31/16
Retained earnings, 12/31/16
Net income for 2016
Dividends declared and paid during 2016
Retained earnings, 1/1/16
Firm A
$ 412,000
217,000
83,000
112,000
78,000
43,000
77,000
Firm B
$ 543,000
148,000
95,000
300,000
74,000
13,000
Firm C
$ 317,000
37,000
120,000
71,000
32,000
A
14
D
Y
Expert Solution
This question has been solved!
Explore an expertly crafted, step-by-step solution for a thorough understanding of key concepts.
This is a popular solution
Trending nowThis is a popular solution!
Step by stepSolved in 3 steps

Knowledge Booster
Learn more about
Need a deep-dive on the concept behind this application? Look no further. Learn more about this topic, accounting and related others by exploring similar questions and additional content below.Similar questions
- Weighted Average Cost of Capital The December 31, 2018, partial financial statements taken from the annual report for AT&T Inc. (T ) follow. Consolidated Statements of Income Dollars in millions except per share amounts 2018 2017 Operating revenues Service $152,345 $145,597 Equipment 18,411 14,949 Total operating revenues 170,756 160,546 Operating expenses Equipment 19,786 18,709 Broadcast, programming and operations 26,727 21,159 Other cost of services (exclusive of depreciation and amortization show separately below) 32,906 37,942 Selling, general and administrative 36,765 35,465 Abandonment of network assets 46 2,914 Depreciation and amortization 28,430 24,387 Total operating expenses 144,660 140,576 Operating income 26,096 19,970 Other income (expense): Interest expense (7,957) (6,300) Equity in net income of affiliates (48) (128)…arrow_forwardDomesticarrow_forwardFind Percentages and show workarrow_forward
- Consider the following partial income statements and balance sheets for Lillard Corp. For the year ended December 31, Net income Less income attributable to noncontrolling 5,700 interests Net income attributable to Lillard Corp. 100,400 107,300 Lillard Corp. shareholders' equity Noncontrolling interests Total equity What is Lillard's return on equity for 2024? 11.7% O 11.5% 12.3% 11.9% 2024 2023 108,000 113,000 11.1% 7,600 Dec. 31, 2024 Dec. 31, 2023 861,000 888,000 32,400 30,600 893,400 918,600arrow_forwardBalance sheet data for X Corporation and Z Company on December 31, 2015 are given below: Cash Accounts receivable PPE Investment in Garnet Total assets Current liabilities Long term liabilities Ordinary share Retained earnings Total liabilities and stockholders' equity X Corp. Z. Co. 70,000 90,000 100,000 60,000 500,000 250,000 260,000 930,000 400,000 180,000 60,000 200,000 90,000 300,000 100,000 250,000 150,000 930,000 400,000 X Corporation purchased 80% interest in Z Company on December 31, 2015 for P260,000. Z Company's property and equipment had a fair value of P50,000 more than the book value shown above. All other book values approximated fair value. Fair value method was elected to be used in measuring the non-controlling interest. Fair value of non- controlling interest on acquisition date was P58,000. In the consolidated balance sheet on December 31, 2015: a. The amount of total stockholders' equity to be reported will be? b. The amount of non-controlling interest will be?arrow_forwardComparative balance sheets for Hamilton Company are presented below. Hamilton Company Comparative Balance Sheet Decemebr 31 Assets 2017 2016 Cash 78000 12000 Accoutns Receivable 93000 76000 Inventory 180000 189000 Land 75000 100000 Equipemnt 250000 210000 Accu Dep - Equipment (66,000) (42,000) Total 610000 545000 Liability and Equity Accounts Payable 34000 47000 Bonds Payable 150000 200000 Common Stock ($1 Par ) 214000 164000 Retained Earnings 212000 134000 Total 610000 545000 Additional information: 1. Net income for 2017 was $134000 2. Cash dividends of $65,000 were declared and paid. 3. Bonds payable amounting to $50,000 were redeemed for cash $50,000.…arrow_forward
- Horizontal Analysis The comparative accounts payable and long-term debt balances for a company follow. Current Year Previous Year Accounts payable $79,375 $63,500 Long-term debt 43,741 52,700 Based on this information, what is the amount and percentage of increase or decrease that would be shown on a balance sheet with horizontal analysis? Enter all answers as positive numbers.arrow_forwardperating data for Navarro Corporation are presented below. Current assets Plant assets (net) Current liabilities Long-term liabilities Common stock, $1 par Retained earnings Instructions December 31, 2017 $125,000 396,000 91,000 133,000 161,000 136,000 December 31, 2016 $100,000 330,000 70,000 95,000 115,000 150,000 Prepare horizontal and vertical analyses. (LO 1) Prepare a schedule showing a vertical analysis for 2017 and 2016. E18-3 The comparative condensed balance sheets of Gurley Corporationarrow_forward
arrow_back_ios
arrow_forward_ios
Recommended textbooks for you

 AccountingAccountingISBN:9781337272094Author:WARREN, Carl S., Reeve, James M., Duchac, Jonathan E.Publisher:Cengage Learning,
 Accounting Information SystemsAccountingISBN:9781337619202Author:Hall, James A.Publisher:Cengage Learning,
 Horngren's Cost Accounting: A Managerial Emphasis...AccountingISBN:9780134475585Author:Srikant M. Datar, Madhav V. RajanPublisher:PEARSON
 Intermediate AccountingAccountingISBN:9781259722660Author:J. David Spiceland, Mark W. Nelson, Wayne M ThomasPublisher:McGraw-Hill Education
 Financial and Managerial AccountingAccountingISBN:9781259726705Author:John J Wild, Ken W. Shaw, Barbara Chiappetta Fundamental Accounting PrinciplesPublisher:McGraw-Hill Education


Accounting
Accounting
ISBN:9781337272094
Author:WARREN, Carl S., Reeve, James M., Duchac, Jonathan E.
Publisher:Cengage Learning,

Accounting Information Systems
Accounting
ISBN:9781337619202
Author:Hall, James A.
Publisher:Cengage Learning,

Horngren's Cost Accounting: A Managerial Emphasis...
Accounting
ISBN:9780134475585
Author:Srikant M. Datar, Madhav V. Rajan
Publisher:PEARSON

Intermediate Accounting
Accounting
ISBN:9781259722660
Author:J. David Spiceland, Mark W. Nelson, Wayne M Thomas
Publisher:McGraw-Hill Education

Financial and Managerial Accounting
Accounting
ISBN:9781259726705
Author:John J Wild, Ken W. Shaw, Barbara Chiappetta Fundamental Accounting Principles
Publisher:McGraw-Hill Education