MATLAB: An Introduction with Applications
6th Edition
ISBN: 9781119256830
Author: Amos Gilat
Publisher: John Wiley & Sons Inc
expand_more
expand_more
format_list_bulleted
Concept explainers
infoPractice Pack
Question
infoPractice Pack

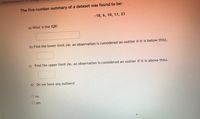
Transcribed Image Text:### Five Number Summary: Understanding Outliers and IQR
---
**The five number summary of a dataset was found to be:**
\-18, 6, 10, 11, 23
---
**Questions:**
1. **What is the IQR?**
_Answer:_ `__________`
2. **Find the lower limit** (ie: an observation is considered an outlier if it is below this).
_Answer:_ `__________`
3. **Find the upper limit** (ie: an observation is considered an outlier if it is above this).
_Answer:_ `__________`
4. **Do we have any outliers?**
- o No
- o Yes
_Answer:_ `__________`
---
**Explanation of Terms:**
- **IQR (Interquartile Range)**: A measure of statistical dispersion, or how spread out the data points are in a dataset. It is calculated as the difference between the third quartile (Q3) and the first quartile (Q1).
- **Lower Limit**: To determine if a data point is an outlier on the lower end, we use the formula: Q1 - 1.5 * IQR.
- **Upper Limit**: To determine if a data point is an outlier on the upper end, we use the formula: Q3 + 1.5 * IQR.
- **Outliers**: Data points that fall below the lower limit or above the upper limit.
By understanding and applying these concepts, you can accurately identify outliers and gain more insights from your data analysis.
Expert Solution
This question has been solved!
Explore an expertly crafted, step-by-step solution for a thorough understanding of key concepts.
Includes step-by-step video
Learn your wayIncludes step-by-step video
Step by stepSolved in 2 steps with 2 images

Knowledge Booster
Learn more about
Need a deep-dive on the concept behind this application? Look no further. Learn more about this topic, statistics and related others by exploring similar questions and additional content below.Similar questions
- View attatched photo and answer questions below. Thank You! A) Find the quartiles. The first quartile Q1 is? The second quartile Q2 is? The third quartile Q3 is? B) Find the interquartile range (IQR)? C) Identify any outliers.arrow_forwardPlease see the image below. I believe I have chosen the correct answer for this, but I just want to get a second opinion.arrow_forwardPlease show work on paper and circle answerarrow_forward
- The data set available below represents the length of life, in seconds, of 50 fruit flies subject to a new spray in a controlled laboratory experiment. Comment on any outliers in the data. Click the icon to view the data. The data contains possible outlier(s). (Type a whole number.) Save Clear all Check answer /1)arrow_forwardPART D TO BE ANSWERED! Thank you!arrow_forwardA random sample of n=102 was asked what color they most liked to wear as one question in a survey. What type of graph would be best to display the data below? Note: please do not capitalize your answers when typing them. Color Blue Green Red Purple Yellow Orange # of people 20 15 32 18 15 pie graph histogram O box-and-whiskersarrow_forward
- 11) 14 students on the track team recorded the following number of seconds as their best time for the 100-yard dash: 13.5, 13.7, 13.1, 13.0, 13.3, 13.2, 13.0, 12.8, 13.4, 13.3, 13.1, 12.7, 13.2, 13.5 Find the interquartile range.arrow_forwardFive number summary and box plot Find the 5 number summary for the following set of (n=15) data points 44, 48, 51, 54, 56, 59, 60, 61, 64, 68, 73, 78, 93, 103, 122 Also compute the IQR and state the lower and upper fence. Are there any outliers. Give the box plot.arrow_forwardThe data represent the time, in minutes, spent reading a political blog in a day. Construct a frequency distribution using 5 classes. In the table, include the midpoints, relative frequencies, and cumulative frequencies. Which class has the greatest frequency and which has the least frequency? C Complete the table, starting with the lowest class limit. (Simplify your answers.) Class Frequency Midpoint 17 "" Which class has the greatest frequency? The class with the greatest frequency is from to Which class has the least frequency? The class with the least frequency is from to 32 3 32 6 Relative Frequency 28 39 5 25 11 9 8 27 15 8 38 30 24 17 0 30 Cumulative Frequency Qarrow_forward
arrow_back_ios
arrow_forward_ios
Recommended textbooks for you
 MATLAB: An Introduction with ApplicationsStatisticsISBN:9781119256830Author:Amos GilatPublisher:John Wiley & Sons Inc
 Probability and Statistics for Engineering and th...StatisticsISBN:9781305251809Author:Jay L. DevorePublisher:Cengage Learning
 Statistics for The Behavioral Sciences (MindTap C...StatisticsISBN:9781305504912Author:Frederick J Gravetter, Larry B. WallnauPublisher:Cengage Learning
 Elementary Statistics: Picturing the World (7th E...StatisticsISBN:9780134683416Author:Ron Larson, Betsy FarberPublisher:PEARSON
 The Basic Practice of StatisticsStatisticsISBN:9781319042578Author:David S. Moore, William I. Notz, Michael A. FlignerPublisher:W. H. Freeman
 Introduction to the Practice of StatisticsStatisticsISBN:9781319013387Author:David S. Moore, George P. McCabe, Bruce A. CraigPublisher:W. H. Freeman

MATLAB: An Introduction with Applications
Statistics
ISBN:9781119256830
Author:Amos Gilat
Publisher:John Wiley & Sons Inc

Probability and Statistics for Engineering and th...
Statistics
ISBN:9781305251809
Author:Jay L. Devore
Publisher:Cengage Learning

Statistics for The Behavioral Sciences (MindTap C...
Statistics
ISBN:9781305504912
Author:Frederick J Gravetter, Larry B. Wallnau
Publisher:Cengage Learning

Elementary Statistics: Picturing the World (7th E...
Statistics
ISBN:9780134683416
Author:Ron Larson, Betsy Farber
Publisher:PEARSON

The Basic Practice of Statistics
Statistics
ISBN:9781319042578
Author:David S. Moore, William I. Notz, Michael A. Fligner
Publisher:W. H. Freeman

Introduction to the Practice of Statistics
Statistics
ISBN:9781319013387
Author:David S. Moore, George P. McCabe, Bruce A. Craig
Publisher:W. H. Freeman