
MATLAB: An Introduction with Applications
6th Edition
ISBN: 9781119256830
Author: Amos Gilat
Publisher: John Wiley & Sons Inc
expand_more
expand_more
format_list_bulleted
Related questions
Question
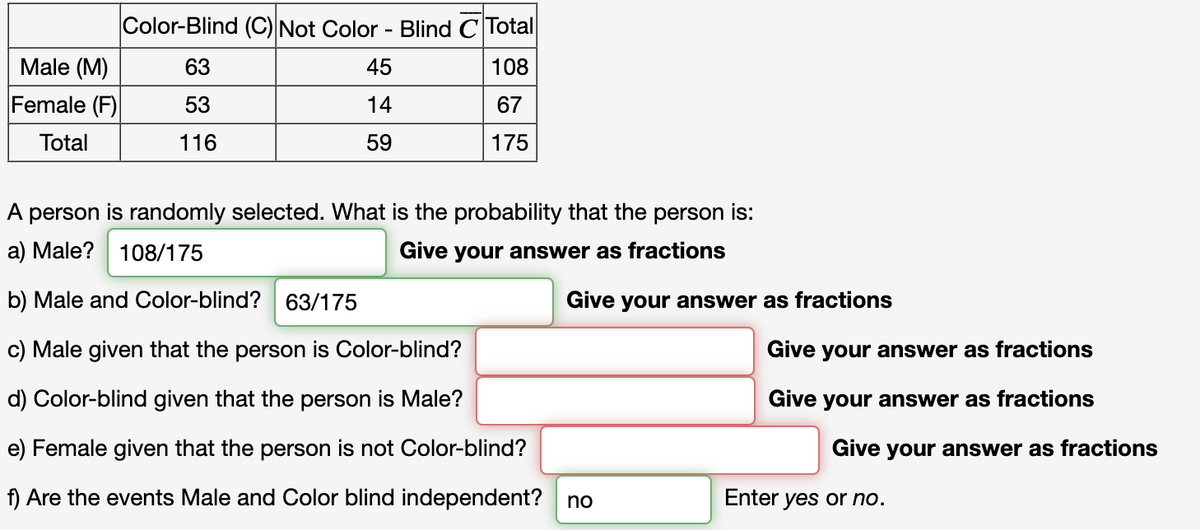
In a survey of 175 people, the following data were obtained relating gender to color-blindness. Please show the details.

Transcribed Image Text:Male (M)
Female (F)
Total
Color-Blind (C) Not Color - Blind C Total
45
108
14
67
59
175
63
53
116
A person is randomly selected. What is the probability that the person is:
a) Male? 108/175
Give your answer as fractions
b) Male and Color-blind? 63/175
c) Male given that the person is Color-blind?
d) Color-blind given that the person is Male?
e) Female given that the person is not Color-blind?
f) Are the events Male and Color blind independent? no
Give your answer as fractions
Give your answer as fractions
Give your answer as fractions
Give your answer as fractions
Enter yes or no.
Expert Solution
This question has been solved!
Explore an expertly crafted, step-by-step solution for a thorough understanding of key concepts.

This is a popular solution

Trending nowThis is a popular solution!

Step by stepSolved in 4 steps

Knowledge Booster

Similar questions
- Need assistance with this certain problemarrow_forwardTwenty-nine college students, identified as having a positive attitude about Mitt Romney as compared to Barack Obama in the 2012 presidential election, were asked to rate how trustworthy the face of Mitt Romney appeared, as represented in their mental image of Mitt Romney’s face. Ratings were on a scale of 0 to 7, with 0 being “not at all trustworthy” and 7 being “extremely trustworthy.” Here are the 29 ratings: 2.6 3.2 3.7 3.3 3.4 3.6 3.7 3.8 3.9 4.1 4.2 4.9 5.7 4.2 3.9 3.2 4.5 5.0 5.0 4.6 4.6 3.9 3.9 5.3 2.8 2.6 3.0 3.3 3.7 a 95% confidence interval for the mean rating. Is there significant evidence at the 5% level that the mean rating is greater than 3.5 (a neutral rating)?arrow_forwardYou are given the following set of observations: 41, 29, 38, 19, 22, 34, 50, 42, 40, 44. What is the value of the IQR?arrow_forward
- 600 students at Drew High School were surveyed. 269 of them were males. 455 of the students' wear jewelry, and 300 of the students that wear jewelry are females.arrow_forwardWhich of the following data sets shows categorical data? Course Grade 72 78 85 90 98 Class Size 22 23 25 28 32 Flight Number 1002 1274 4012 5661 7812 Number of Coins 1 3 4 8 19arrow_forwardA recent health survey 500 single young men yielded the following information: 385 were a member of a sports club, 155 were vegetarian, and 30 declined to answer the survey’s questions. What percent of the men were both members of a sports club and vegetarian? Draw a Venn diagram to illustrate the result of the survey.arrow_forward
- There are 15 numbers on a list, and the smallest number is changed from 4 to 0.4.a) Is it possible to determine by how much the mean changes? If so, by how much does it change?b) Is it possible to determine the value of the mean after the change? If so, what is the value?c) Is it possible to determine by how much the median changes? If so, by how much does it change?d) Is it possible to determine by how much the standard deviation changes? If so, by how much does it changearrow_forwardGiven the data below; 320,332,339,343,345,348,351,352,364,376. a) find the mode.arrow_forwardGiven the following list of data, what is the five-number summary?110, 111, 140, 190, 199, 204, 238, 270, 279, 310, 320 Select the correct answer below: Min Q1 Median Q3 Max 100 140 204 279 350 Min Q1 Median Q3 Max 110 111 204 279 300 Min Q1 Median Q3 Max 110 140 204 279 320arrow_forward
arrow_back_ios
arrow_forward_ios
Recommended textbooks for you
- MATLAB: An Introduction with ApplicationsStatisticsISBN:9781119256830Author:Amos GilatPublisher:John Wiley & Sons Inc
 Probability and Statistics for Engineering and th...StatisticsISBN:9781305251809Author:Jay L. DevorePublisher:Cengage Learning
 Statistics for The Behavioral Sciences (MindTap C...StatisticsISBN:9781305504912Author:Frederick J Gravetter, Larry B. WallnauPublisher:Cengage Learning
  Elementary Statistics: Picturing the World (7th E...StatisticsISBN:9780134683416Author:Ron Larson, Betsy FarberPublisher:PEARSON
 The Basic Practice of StatisticsStatisticsISBN:9781319042578Author:David S. Moore, William I. Notz, Michael A. FlignerPublisher:W. H. Freeman
 Introduction to the Practice of StatisticsStatisticsISBN:9781319013387Author:David S. Moore, George P. McCabe, Bruce A. CraigPublisher:W. H. Freeman
MATLAB: An Introduction with Applications
Statistics
ISBN:9781119256830
Author:Amos Gilat
Publisher:John Wiley & Sons Inc
Probability and Statistics for Engineering and th...
Statistics
ISBN:9781305251809
Author:Jay L. Devore
Publisher:Cengage Learning
Statistics for The Behavioral Sciences (MindTap C...
Statistics
ISBN:9781305504912
Author:Frederick J Gravetter, Larry B. Wallnau
Publisher:Cengage Learning
Elementary Statistics: Picturing the World (7th E...
Statistics
ISBN:9780134683416
Author:Ron Larson, Betsy Farber
Publisher:PEARSON
The Basic Practice of Statistics
Statistics
ISBN:9781319042578
Author:David S. Moore, William I. Notz, Michael A. Fligner
Publisher:W. H. Freeman
Introduction to the Practice of Statistics
Statistics
ISBN:9781319013387
Author:David S. Moore, George P. McCabe, Bruce A. Craig
Publisher:W. H. Freeman