MATLAB: An Introduction with Applications
6th Edition
ISBN: 9781119256830
Author: Amos Gilat
Publisher: John Wiley & Sons Inc
expand_more
expand_more
format_list_bulleted
Concept explainers
Question
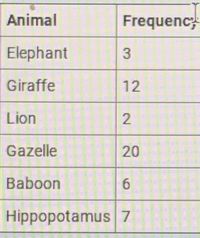
A) Animal and Frequency Graph-
Which type of graph(s) should be used for the following data? Choose all that apply:
- Circle Graph
- Bar Graph
- Dot Plot
- Histogram
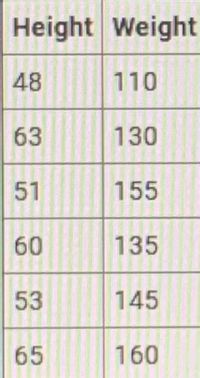
B) Height and Weight Graph-
Which type of graph(s) should be used for the following data? Choose all that apply:
-Circle Graph
-
-Histogram
-Dot plot
C) Which type of graph(s) should be used for the following data? Choose all that apply:
{2.5, 3.2, 4.3, 6.4, 5.5, 2.3, 5.4, 6.6, 7.6, 6.1, 3.1, 4.3, 5.2}
-Stem-and-Leaf plot
-Box plot
-Histogram
-Scatter plot

Transcribed Image Text:Animal
Frequenc
Elephant
Giraffe
12
Lion
Gazelle
20
Baboon
6.
Hippopotamus 7
3.
2.

Transcribed Image Text:Height Weight
48
110
63
130
51
155
60
135
53
145
65
160
Expert Solution
This question has been solved!
Explore an expertly crafted, step-by-step solution for a thorough understanding of key concepts.
This is a popular solution
Trending nowThis is a popular solution!
Step by stepSolved in 2 steps with 2 images

Knowledge Booster
Learn more about
Need a deep-dive on the concept behind this application? Look no further. Learn more about this topic, statistics and related others by exploring similar questions and additional content below.Similar questions
- Please answer number 8. Show work!!arrow_forwarda) Create a frequency table to organize the data b) Create a frequency histogram for the data ( 1. Write each column- Sum, Tally, Frequency 2. Give the frequency histogram) c) State 2 any trends, patterns or observations in this data? ( Describe each trend in detail ) d) What proportion, as a fraction, of the data has a value of 6 or less? e) What number of data has a value of 9 or greater? f) What percentage of the data has a value of 9 or greater?arrow_forwardAt a local supermarket, a group of taste-testers were asked to rate a new food product on a scale of 1 to 5, ranging from bad taste through excellent taste. Identify the most appropriate graph to describe the given data. histogram scatterplot bar graph stem-and-leaf plotarrow_forward
- Graph the set of data using the appropriate type of graph (bar graph, line graph, scatter graph, or pie chart) TABLE 5 Favorite Vegetables Boys Girls Broccoli 2 5 Carrots 6 7 Corn 10 8 Peas 8 5 Squash 5 6arrow_forwardB) has more than one answer .. Thank youarrow_forwardFor the following line graph, State at least one type of conclusion that could be made from the data provided for the KPI. Suggest one other data source that would provide more information to make data-driven decisions. Explain what information that source would supply. (I used the clustered bar chart) Examples: 1) The completion KPI measures the percentage of South Texas College students who finished their degree or certificate program within six years. From the line graph, it can be seen that the completion rates have remained nearly constant through the years. Data from the THECB was used in this case. 2) Information about the percentage of students who receive credit for attempted courses is available on the South Texas College KPI webpage. According to the data, over the past five years, an increasing number of students have been receiving credit for courses they have attempted. Data on the percentage of students who complete courses, the percentage of students who withdraw…arrow_forward
- The red blood cell count of a healthy person was measured on each of 15 days. The number recorded is measured in 106 cells per microliter. 5.4 5.2 5.0 5.2 5.55.3 5.4 5.2 5.1 5.35.3 4.9 5.4 5.2 5.2 A. Choose from the choices the most applicable graph to describe the data. - dotplot, histogram, stem leaf plot, or line graph? Why? B. Describe the shape of the data distribution. Explain your answer. C. Describe the location of the red blood cell counts. Explain your answer.arrow_forwardObjective: Students will be able to 1) Create a box-and-whisker plot, 2) Interpret a box-and-whisker plot, and Identify cumulative frequency. How do I interpret a box-and-whisker plot? I 1. What does the x-axis show? Boys 2. What does the y-axis represent? 3. What does the length of Girls each of the lines (red and green) mean? 4. Does the size of the box 2. 8 10 12 14 16 18 20 22 24 Time (s) matter? How to create a box-and-whisker plot: To draw a box-and-whisker plot you need five pieces of information, called the five-number summary: the smallest value, the lower quartile (LQ), the median, the upper quartile (U0) and the largest value. An outlier is a value that is much smaller or much larger than the other values. An outlier is a point less than the LQ-1.5x 1QR or greater than the UQ+1.5xIQR.arrow_forward
arrow_back_ios
arrow_forward_ios
Recommended textbooks for you
 MATLAB: An Introduction with ApplicationsStatisticsISBN:9781119256830Author:Amos GilatPublisher:John Wiley & Sons Inc
 Probability and Statistics for Engineering and th...StatisticsISBN:9781305251809Author:Jay L. DevorePublisher:Cengage Learning
 Statistics for The Behavioral Sciences (MindTap C...StatisticsISBN:9781305504912Author:Frederick J Gravetter, Larry B. WallnauPublisher:Cengage Learning
 Elementary Statistics: Picturing the World (7th E...StatisticsISBN:9780134683416Author:Ron Larson, Betsy FarberPublisher:PEARSON
 The Basic Practice of StatisticsStatisticsISBN:9781319042578Author:David S. Moore, William I. Notz, Michael A. FlignerPublisher:W. H. Freeman
 Introduction to the Practice of StatisticsStatisticsISBN:9781319013387Author:David S. Moore, George P. McCabe, Bruce A. CraigPublisher:W. H. Freeman

MATLAB: An Introduction with Applications
Statistics
ISBN:9781119256830
Author:Amos Gilat
Publisher:John Wiley & Sons Inc

Probability and Statistics for Engineering and th...
Statistics
ISBN:9781305251809
Author:Jay L. Devore
Publisher:Cengage Learning

Statistics for The Behavioral Sciences (MindTap C...
Statistics
ISBN:9781305504912
Author:Frederick J Gravetter, Larry B. Wallnau
Publisher:Cengage Learning

Elementary Statistics: Picturing the World (7th E...
Statistics
ISBN:9780134683416
Author:Ron Larson, Betsy Farber
Publisher:PEARSON

The Basic Practice of Statistics
Statistics
ISBN:9781319042578
Author:David S. Moore, William I. Notz, Michael A. Fligner
Publisher:W. H. Freeman

Introduction to the Practice of Statistics
Statistics
ISBN:9781319013387
Author:David S. Moore, George P. McCabe, Bruce A. Craig
Publisher:W. H. Freeman