
MATLAB: An Introduction with Applications
6th Edition
ISBN: 9781119256830
Author: Amos Gilat
Publisher: John Wiley & Sons Inc
expand_more
expand_more
format_list_bulleted
Related questions
Question
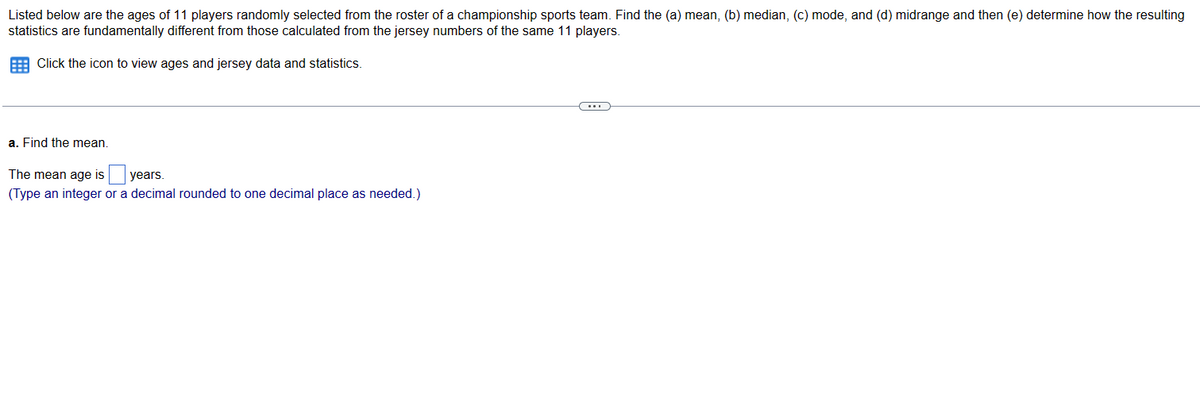

Transcribed Image Text:Listed below are the ages of 11 players randomly selected from the roster of a championship sports team. Find the (a) mean, (b) median, (c) mode, and (d) midrange and then (e) determine how the resulting
statistics are fundamentally different from those calculated from the jersey numbers of the same 11 players.
Click the icon to view ages and jersey data and statistics.
a. Find the mean.
The mean age is
years.
(Type an integer or a decimal rounded to one decimal place as needed.)

Transcribed Image Text:Ages and Jersey Data
Ages 42 25 31 29 34 26 24 28 28 31 24
12 22 46 14 15 87 78 59 57 71 66
Jersery
Numbers
mean
47.9
median
57
mode
none
min
12
max
87
midrange
49.5
I
Expert Solution
This question has been solved!
Explore an expertly crafted, step-by-step solution for a thorough understanding of key concepts.

This is a popular solution

Trending nowThis is a popular solution!

Step by stepSolved in 3 steps

Knowledge Booster

Similar questions
- Please answer the question in the photo attached. Thank You!arrow_forwardUse technology to calculate the mean, median and mode for the following data sets. Monthly rent ($) {625,750,800,650,725,850,625,650,625,1250}arrow_forwardThe table shows, for four cruises, the numbers of crew members, passengers, and entertainers (not included as passengers). Find (a) the mean and (b) the median total number of persons per cruise. Cruise Cruise 1 Cruise 2 Cruise 3 Cruise 4 Crew Passengers 1600 3400 1300 2500 183 225 177 213 Entertainers 40 75 10 55arrow_forward
- A local store owner is interested in finding the mean age of her customers. She randomly surveys 82 customers and records their age. Identify the population, sample, variable, type of variable, parameter, and statistic.arrow_forwardPlease answer the questions in the photo. TY! Both screenshots are for the same questionarrow_forwardAn insurance company crashed four cars of the same model at 5 miles per hour. The costs of repair for each of the four crashes were $406, $414, $483, and $217 O . Compute the mean, median, and mode cost of repair. Compute the mean cost of repair. Select the correct choice below and, if necessary, fill in the answer box to complete your choice. A. The mean cost of repair is $ (Round to the nearest cent as needed.) B. The mean does not exist. Compute the median cost of repair. Select the correct choice below and, if necessary, fill in the answer box to complete your choice. O A. The median cost of repair is $ (Round to the nearest cent as needed.) B. The median does not exist. Compute the mode cost of repair. Select the correct choice below and, if necessary, fill in the answer box to complete your choice. O A. The mode cost of repair is $ -(Round to the nearest cent as needed.) B. The mode does not exist.arrow_forward
- Find the mean, median and mode of the given sample. How would the mean, and median change if the highest salar is omitted? $250,00, $300,000, $350147, $232,425, $360,000, $1,231,421, $810,000, $229,000arrow_forwardDetermine the median and mode from the histogram.arrow_forwardFind the mean of the following data set. Assume the data set is a sample. Round your answer to the nearest hundredth, if necessary. 30 45 35 37, 38, 38, 39, 33, 33, 36, 32, 26, 43, 30 20arrow_forward
- We are going to calculate the mean, median, and mode for two sets of data. Please show your answer to one decimal place if necessary.Here is the first data set. 48 78 53 22 45 42 61 97 87 22 54 what is the mean (¯xx¯) of this data set? What is the median of this data set? What is the mode of this data set? Here is the second data set. 49 84 44 89 74 26 80 39 92 49 What is the mean (¯xx¯) of this data set? What is the median of this data set? What is the mode of this data set?arrow_forwardGiven the following list of data, find the median. 22,33,17,8,17,29,18,13,26,28arrow_forwardIf 99 people had a mean income of $12,500, how much is the mean income increased by the addition of a single income of $240,000? The mean income increases by $arrow_forward
arrow_back_ios
SEE MORE QUESTIONS
arrow_forward_ios
Recommended textbooks for you
- MATLAB: An Introduction with ApplicationsStatisticsISBN:9781119256830Author:Amos GilatPublisher:John Wiley & Sons Inc
 Probability and Statistics for Engineering and th...StatisticsISBN:9781305251809Author:Jay L. DevorePublisher:Cengage Learning
 Statistics for The Behavioral Sciences (MindTap C...StatisticsISBN:9781305504912Author:Frederick J Gravetter, Larry B. WallnauPublisher:Cengage Learning
  Elementary Statistics: Picturing the World (7th E...StatisticsISBN:9780134683416Author:Ron Larson, Betsy FarberPublisher:PEARSON
 The Basic Practice of StatisticsStatisticsISBN:9781319042578Author:David S. Moore, William I. Notz, Michael A. FlignerPublisher:W. H. Freeman
 Introduction to the Practice of StatisticsStatisticsISBN:9781319013387Author:David S. Moore, George P. McCabe, Bruce A. CraigPublisher:W. H. Freeman
MATLAB: An Introduction with Applications
Statistics
ISBN:9781119256830
Author:Amos Gilat
Publisher:John Wiley & Sons Inc
Probability and Statistics for Engineering and th...
Statistics
ISBN:9781305251809
Author:Jay L. Devore
Publisher:Cengage Learning
Statistics for The Behavioral Sciences (MindTap C...
Statistics
ISBN:9781305504912
Author:Frederick J Gravetter, Larry B. Wallnau
Publisher:Cengage Learning
Elementary Statistics: Picturing the World (7th E...
Statistics
ISBN:9780134683416
Author:Ron Larson, Betsy Farber
Publisher:PEARSON
The Basic Practice of Statistics
Statistics
ISBN:9781319042578
Author:David S. Moore, William I. Notz, Michael A. Fligner
Publisher:W. H. Freeman
Introduction to the Practice of Statistics
Statistics
ISBN:9781319013387
Author:David S. Moore, George P. McCabe, Bruce A. Craig
Publisher:W. H. Freeman