MATLAB: An Introduction with Applications
6th Edition
ISBN: 9781119256830
Author: Amos Gilat
Publisher: John Wiley & Sons Inc
expand_more
expand_more
format_list_bulleted
Question

Transcribed Image Text:3
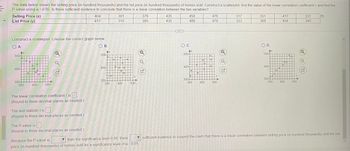
The data below shows the selling price (in hundred thousands) and the list price (in hundred thousands) of homes sold. Construct a scatterplot, find the value of the linear correlation coefficient r, and find the
P-value using a = 0.05. Is there sufficient evidence to conclude that there is a linear correlation between the two variables?
Selling Price (x)
List Price (y)
Construct a scatterplot. Choose the correct graph below.
O A.
OB.
500-
400-
300-
300
Q
O
O
0
O
O
O
O
400
O
O
X
500
The linear correlation coefficient r is
(Round to three decimal places as needed.)
The test statistic t is
(Round to three decimal places as needed.)
404
411
The P-value is
(Round to three decimal places as needed.)
500-
400-
300
300
O
O
b
301
315
O
O
O
O
400
O
O
O
X
500
than the significance level 0.05, there
Because the P-value is
price (in hundred thousands) of homes sold for a significance level of a = 0.05.
376
385
435
435
458
489
O C.
Ay
500-
400-
O
p
300+
300
a
p
O
O
O
400
b
O
O
476
479
X
500
✔
317
323
351
368
O D.
500
400-
Y
300
300
O
a
417
434
20
400
X
500
331
340
sufficient evidence to support the claim that there is a linear correlation between selling price (in hundred thousands) and the list
Expert Solution
This question has been solved!
Explore an expertly crafted, step-by-step solution for a thorough understanding of key concepts.
Step by stepSolved in 2 steps with 3 images

Knowledge Booster
Similar questions
- Pls help ASAParrow_forwardHelppparrow_forwardThe following double-line graph compares the number of actual home sales to the number of homes for sale from 2000 - 2008. Study the graph and answer the questions that follow. Number of units (In thousands) 8000F Home Sates 7000- Homes for Sale 6000+ 5000+ 4000+ 3000+ 2000- 1000+ 2000 2002 2004 2006 2008 Year ✔ *** a. In what year did the biggest drop in home sales occur? By approximately how many units did sales drop? A. 2007; approximately 1,200,000 O B. 2007; approximately 4,800,000 O C. 2008; approximately 4,800,000 O D. 2008; approximately 1,200,000 b. Identify at least two years when the number of sales and the number of homes for sale both increased. O A. 2001, 2002 OB. 2002, 2005 OC. 2002, 2008 OD. 2001, 2003 c. In what year were home sales at their lowest level? In what year were home sales at their highest level? O A. lowest: 2002; highest: 2006 O B. lowest: 2002; highest: 2008 O C. lowest: 2001; highest: 2006 O D. lowest: 2001; highest: 2007 d. Based on your answer to part…arrow_forward
- %24 3. 3. 2. Question 8 Graph: y < – 1 4. -5 -4 -3 -2 2. 2 Clear All Draw: Question Help: D Video Submit Question MacBook Air 08 F3 F1 F2 F4 F5 F8 23 2$ 2 R H 9arrow_forward* 00 T R 2. %24 E Question 4 <. Sketch a graph of y = – 2 4. -5 -4 -3 -2 -1 4. -2 -3 -4- -5- Clear All Draw: Question Help: D Video Submit Question MacBook Air 08 F3 F1 F2 DD F4 F5 23 2 L 4. 7. Aarrow_forwardNeed helparrow_forward
arrow_back_ios
arrow_forward_ios
Recommended textbooks for you
 MATLAB: An Introduction with ApplicationsStatisticsISBN:9781119256830Author:Amos GilatPublisher:John Wiley & Sons Inc
 Probability and Statistics for Engineering and th...StatisticsISBN:9781305251809Author:Jay L. DevorePublisher:Cengage Learning
 Statistics for The Behavioral Sciences (MindTap C...StatisticsISBN:9781305504912Author:Frederick J Gravetter, Larry B. WallnauPublisher:Cengage Learning
 Elementary Statistics: Picturing the World (7th E...StatisticsISBN:9780134683416Author:Ron Larson, Betsy FarberPublisher:PEARSON
 The Basic Practice of StatisticsStatisticsISBN:9781319042578Author:David S. Moore, William I. Notz, Michael A. FlignerPublisher:W. H. Freeman
 Introduction to the Practice of StatisticsStatisticsISBN:9781319013387Author:David S. Moore, George P. McCabe, Bruce A. CraigPublisher:W. H. Freeman

MATLAB: An Introduction with Applications
Statistics
ISBN:9781119256830
Author:Amos Gilat
Publisher:John Wiley & Sons Inc

Probability and Statistics for Engineering and th...
Statistics
ISBN:9781305251809
Author:Jay L. Devore
Publisher:Cengage Learning

Statistics for The Behavioral Sciences (MindTap C...
Statistics
ISBN:9781305504912
Author:Frederick J Gravetter, Larry B. Wallnau
Publisher:Cengage Learning

Elementary Statistics: Picturing the World (7th E...
Statistics
ISBN:9780134683416
Author:Ron Larson, Betsy Farber
Publisher:PEARSON

The Basic Practice of Statistics
Statistics
ISBN:9781319042578
Author:David S. Moore, William I. Notz, Michael A. Fligner
Publisher:W. H. Freeman

Introduction to the Practice of Statistics
Statistics
ISBN:9781319013387
Author:David S. Moore, George P. McCabe, Bruce A. Craig
Publisher:W. H. Freeman