Algebra and Trigonometry (6th Edition)
6th Edition
ISBN: 9780134463216
Author: Robert F. Blitzer
Publisher: PEARSON
expand_more
expand_more
format_list_bulleted
Question
What type of relation is used to model simple interest?

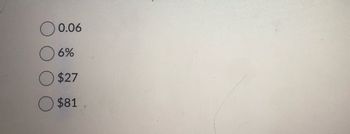
Transcribed Image Text:0.06
6%
$27
$81
Expert Solution
This question has been solved!
Explore an expertly crafted, step-by-step solution for a thorough understanding of key concepts.
Step by stepSolved in 3 steps with 3 images

Knowledge Booster
Similar questions
- The following graph shows the approximate value of the U.S. Consumer Price Index (CPI) from September 2004 through November 2005. On the graph titled "CPI Sep 2004-Nov 2005," the horizontal axis is labeled t and the vertical axis is labeled I(t). The curve begins at the point (0, 190), goes up and right becoming more steep, passes through the approximate point (8, 195), goes up and right becoming less steep, and ends at the approximate point (14, 199.9). The approximating curve shown on the figure is given by I(t) = −0.005t3 + 0.12t2 − 0.01t + 190 (0 ≤ t ≤ 14), where t is time in months since the start of September 2004. (a) Use the model to estimate the monthly inflation rate in July 2005 (t = 10). Recall that the inflation rate is I′(t) I(t) . (Round your answer to three decimal places.) % (b) Was inflation slowing or speeding up in July 2005? slowing downspeeding up (c) When was inflation speeding up? When was inflation slowing?…arrow_forward1. In your own words, describe how you can determine if a relation is a function if the relation is given as (a) a table, (b) a set of points, (c) or a graph.arrow_forward(d) Can you think of other variables that might explain the variation in monthly rent?arrow_forward
- A ball is thrown, and its height is recorded a number of different times. The ball reaches a maximum height of 20 meters after 1.5 seconds. a) sketch the relation. Time is independent variable and height is the dependent variable. b) state a reasonable domain and range for the relation c) is this relation a function? Explain. d) a student decided to use height as the independent variable and time as the dependent variable. Sketch a graph of this relation.arrow_forwardCan you please help me out?arrow_forward9 Draw a graph of y = f(x) such that f(-2) = 5, f(1) = 0, and f(4) = 3. %3|arrow_forward
- what’s the value?arrow_forwardwhat is the constant of variation in this graph?arrow_forwardThe U.S. population can be modeled by the function y=165.6x¹.345, where y is in thousands and x is the number of years after 1800. (a) What was the population in 1970, according to this model? (b) is the graph of this function concave up or concave down? What does this mean? (c) Use numerical or graphical methods to find when the model estimates the population was 94,150,000. (a) According to the model, the population in 1970 was thousands. (Round to the nearest integer as needed.)arrow_forward
- B to Match each equation with a graph above 2(1.16)* a. red (R) 2(1.46)" b. green (G) 3(1.16)* с. blue (B) 2(0.66)" d. orange (0) 2(0.85)* e. black (K)arrow_forwardBody surface area is an important piece of medical information because it is a factor in temperature regulation as well as some drug level determinations. The Mosteller formulat gives one way of estimating body surface area 8 in square meters. The formula uses the weight w in kilograms and the height h in centimeters. The relation is Vhw 60 In this exercise we consider people who are 190 centimeters tall. (a) Write a formula for 8 as a function of w. (b) Make a graph of 8 versus w. Include weights up to 100 kilograms. 3.0 3.0r 25 25 20 20 15 15 1.0 1.0 05 0.5 00 w 00 20 40 60 80 100 20 40 60 80 100 3.0. 3.0 25 25 20 20 1.5 15 1.0 1.0 05 05 w 100 0.0 20 10 60 80 20 10 60 80 100 (c) Is the graph you made in part (b) concave up or concave down? O concave up O concave down (d) In this part we consider the effect of weight gain on men who are 190 centimeters tall. Would the weight gain have a greater effect on surface area for a lighter man or for a he avier man? O lighter man O heavier manarrow_forwardWhat are the graphs of liner relations?arrow_forward
arrow_back_ios
SEE MORE QUESTIONS
arrow_forward_ios
Recommended textbooks for you
 Algebra and Trigonometry (6th Edition)AlgebraISBN:9780134463216Author:Robert F. BlitzerPublisher:PEARSON
 Contemporary Abstract AlgebraAlgebraISBN:9781305657960Author:Joseph GallianPublisher:Cengage Learning
 Linear Algebra: A Modern IntroductionAlgebraISBN:9781285463247Author:David PoolePublisher:Cengage Learning
 Algebra And Trigonometry (11th Edition)AlgebraISBN:9780135163078Author:Michael SullivanPublisher:PEARSON
 Introduction to Linear Algebra, Fifth EditionAlgebraISBN:9780980232776Author:Gilbert StrangPublisher:Wellesley-Cambridge Press
 College Algebra (Collegiate Math)AlgebraISBN:9780077836344Author:Julie Miller, Donna GerkenPublisher:McGraw-Hill Education

Algebra and Trigonometry (6th Edition)
Algebra
ISBN:9780134463216
Author:Robert F. Blitzer
Publisher:PEARSON

Contemporary Abstract Algebra
Algebra
ISBN:9781305657960
Author:Joseph Gallian
Publisher:Cengage Learning

Linear Algebra: A Modern Introduction
Algebra
ISBN:9781285463247
Author:David Poole
Publisher:Cengage Learning

Algebra And Trigonometry (11th Edition)
Algebra
ISBN:9780135163078
Author:Michael Sullivan
Publisher:PEARSON

Introduction to Linear Algebra, Fifth Edition
Algebra
ISBN:9780980232776
Author:Gilbert Strang
Publisher:Wellesley-Cambridge Press

College Algebra (Collegiate Math)
Algebra
ISBN:9780077836344
Author:Julie Miller, Donna Gerken
Publisher:McGraw-Hill Education