MATLAB: An Introduction with Applications
6th Edition
ISBN: 9781119256830
Author: Amos Gilat
Publisher: John Wiley & Sons Inc
expand_more
expand_more
format_list_bulleted
Concept explainers
Question

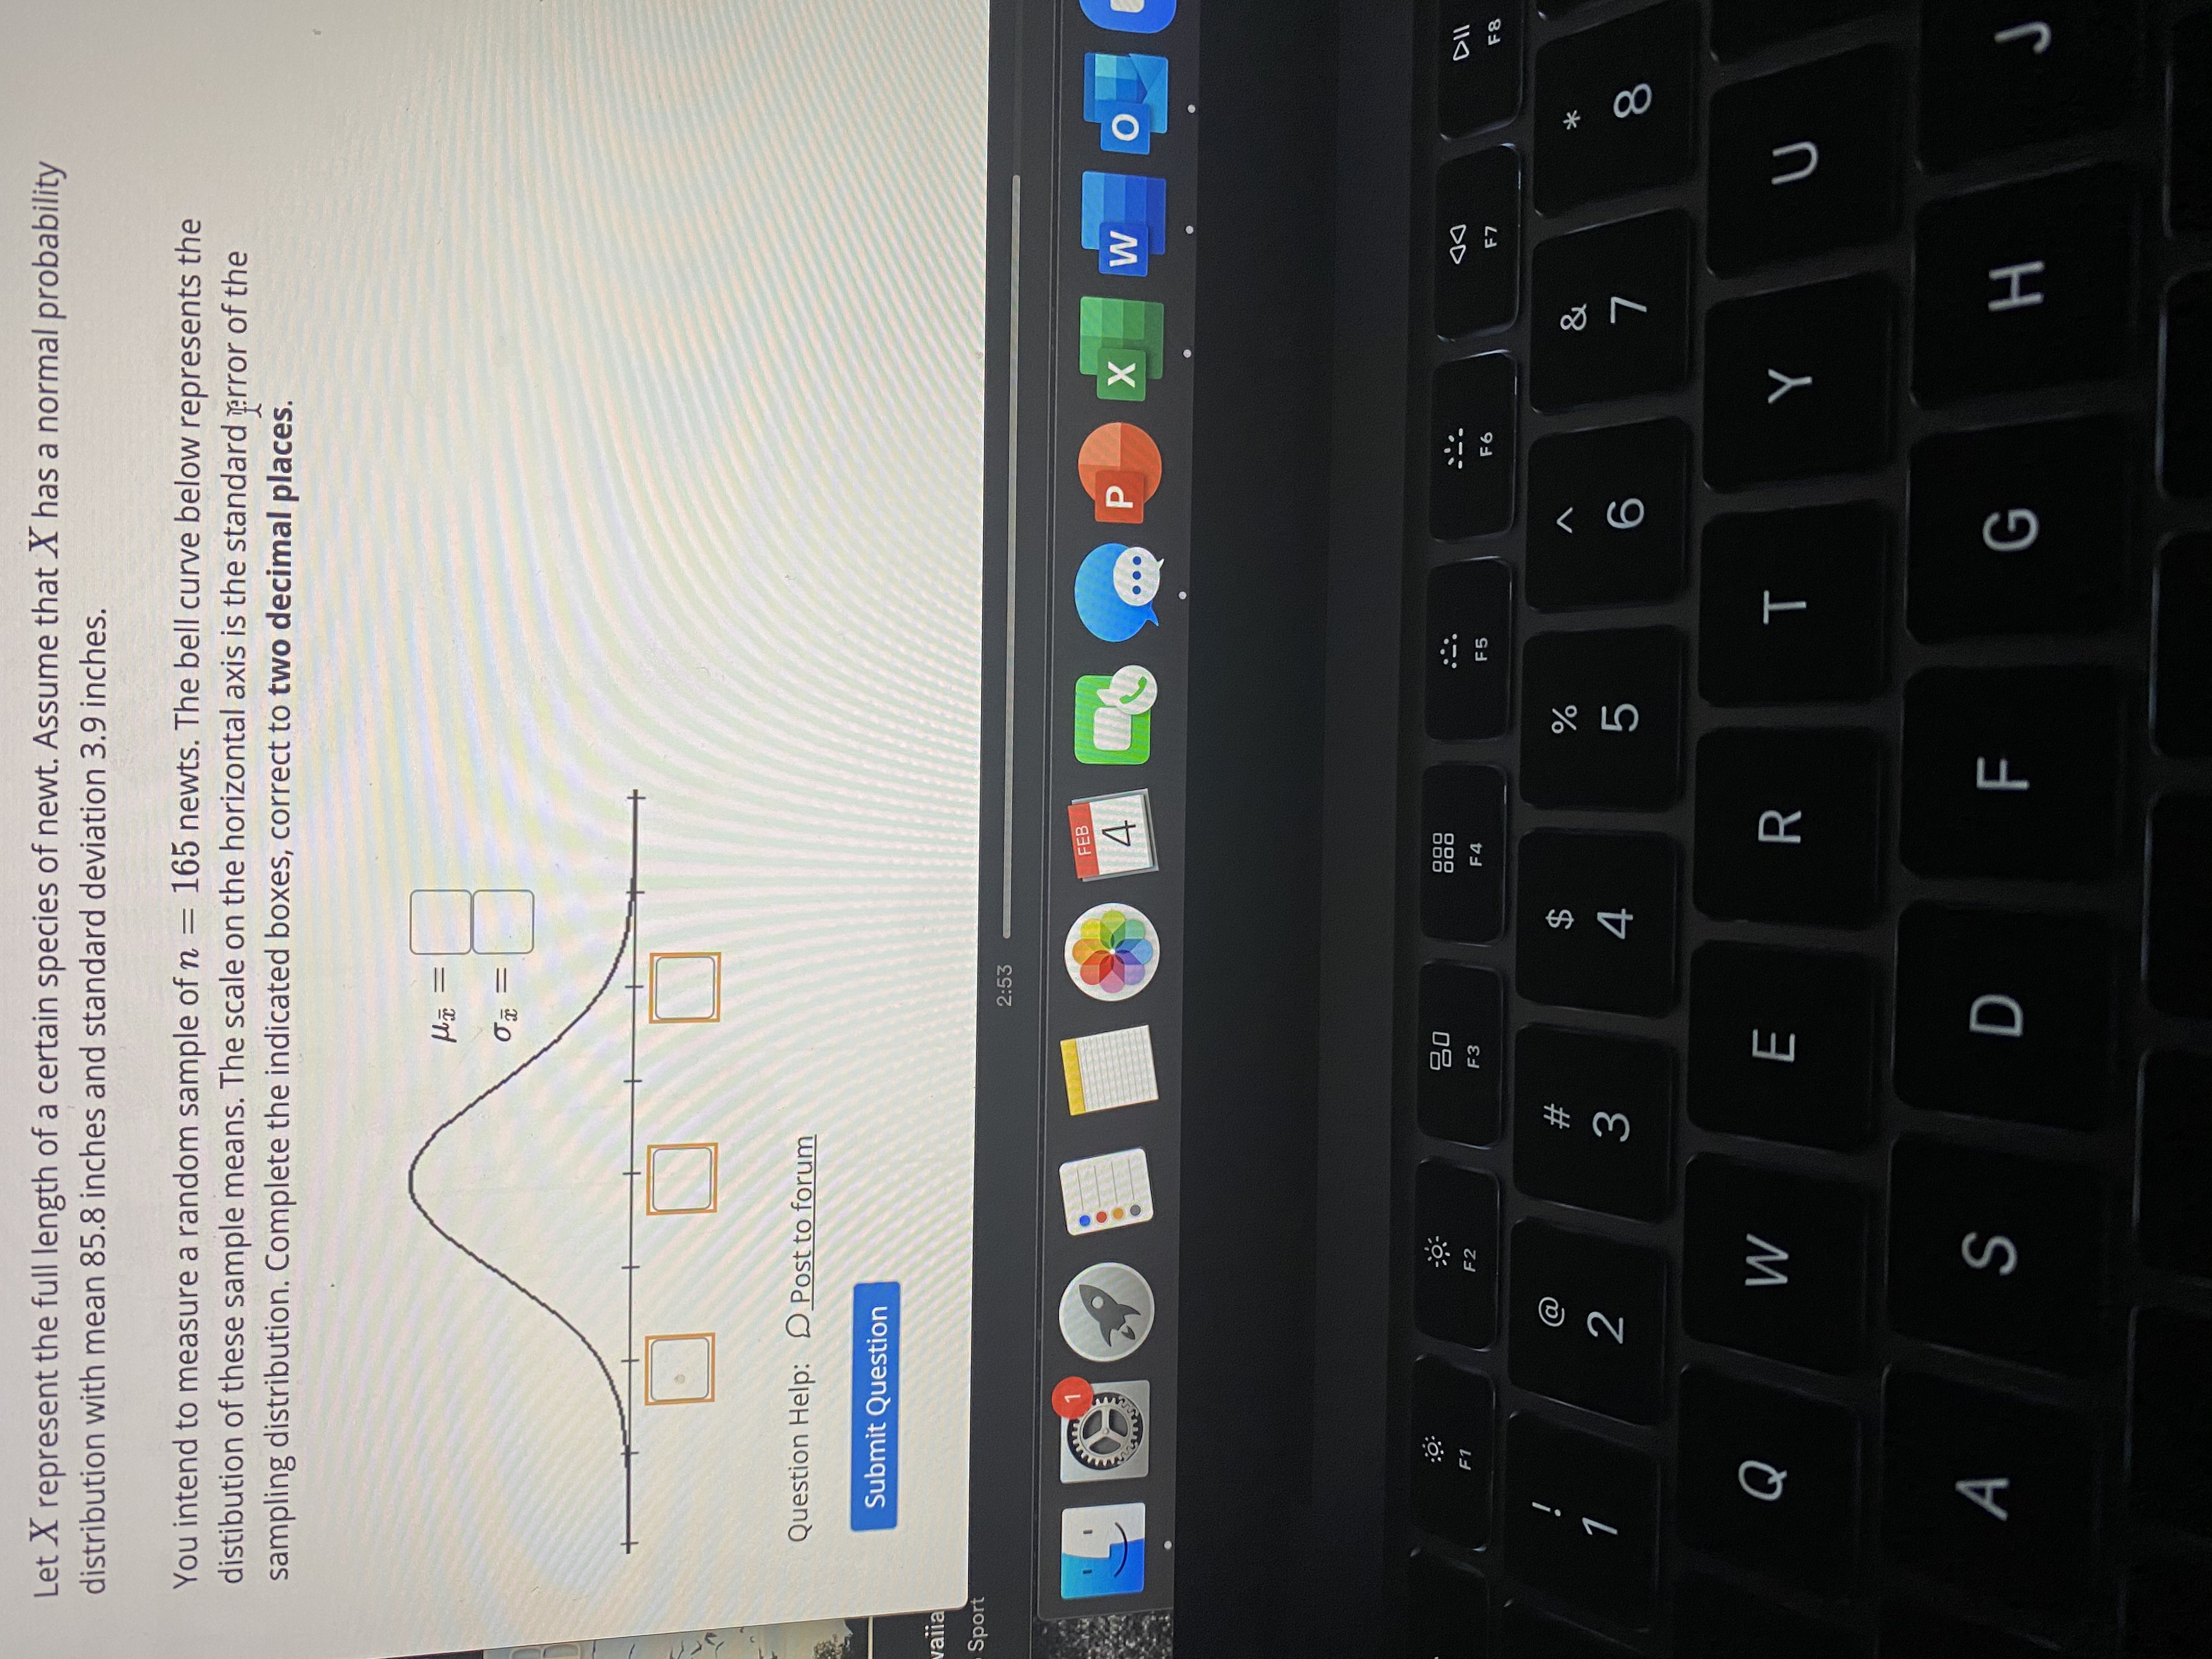
Transcribed Image Text:Let X represent the full length of a certain species of newt. Assume that X has a normal probability
distribution with mean 85.8 inches and standard deviation 3.9 inches.
You intend to measure a random sample of n = 165 newts. The bell curve below represents the
distibution of these sample means. The scale on the horizontal axis is the standard error of the
sampling distribution. Complete the indicated boxes, correct to two decimal places.
%3D
Expert Solution
arrow_forward
Step 1

Trending nowThis is a popular solution!
Step by stepSolved in 2 steps with 4 images

Knowledge Booster
Learn more about
Need a deep-dive on the concept behind this application? Look no further. Learn more about this topic, statistics and related others by exploring similar questions and additional content below.Similar questions
- Suppose that X, Y, and Z are jointly distributed random variables, that is, they are defined on the same sample space. Suppose that we also have the following. E(X)=-1 E(Y) = 4 E (Z)=0 Var(X)=20 Var(Y) = 27 Var (Z) = 38 Compute the values of the expressions below. E (5Z-2) = 0 2Z+X -5 Var(2X-3) = 0 E = E (32²) = 0 Explanation Check X O hp Ⓒ2022 McGraw Hill LLC. All Rights Reserved. Termarrow_forwardUse the standard normal table to find the z-score that corresponds to the given percentile. If the area is not in the table, use the entry closest to the area. If the area is halfway between two entries, use the z-score halfway between the corresponding z-scores. If convenient, use technology to find the z-score. P65arrow_forwardAssume that a randomly selected subject is given a bone density test. Bone density test scores are normally distributed with a mean of 0 and a standard deviation of 1. Draw a graph and find P, the 11th percentile. This is the bone density score separating the bottom 11% from the top 89%. Which graph represents P ? Choose the correct graph below. O A. O B. OD. P11 P11 P11 P11 The bone density score corresponding to P1 is (Round to two decimal places as needed.) Click to select your answer(s). APR tv MacBook Air F9 F10 LLA 20 F3 F6 F8 F4 F5 F1 F2 & #3 7 8. %24arrow_forward
- Previous surveys indicate 33% of households in Barrie regularly recycle household waste through a blue box program. In a random sample of ten households, what is the probability of finding exactly five who regularly use a blue box?arrow_forwardFind the weighted estimate, p to test the claim that p, = p2. Use a = 0.05. The sample statistics listed below are from independent samples. n, = 50, x, = 35, and = 60, x, = 40 O A. 0.682 O B. 0.238 C. 1.367 D. 0.328arrow_forwardAssume that a randomly selected subject is given a bone density test. Those test scores are normally distributed with a mean of 0 and a standard deviation of 1. Draw a graph and find the probability of a bone density test score between 1.83 and 1.83. Sketch the region. Choose the correct graph below. O A. -1.83 1.83 B. -1.83 *** 1.83 O C. -1.83 1.83 O D. -1.83 1.83arrow_forward
- Use the standard normal table to find the z-score that corresponds to the given percentile. If the area is not in the table, use the entry closest to the area. If the area is halfway between two entries, use the z-score halfway between the corresponding z-scores. If convenient, use technology to find the z-score. P80arrow_forwardAssume that thermometer readings are normally distributed with a mean of 0°C and a standard deviation of 1.00°C. A thermometer is randomly selected and tested. For the casebelow, draw a sketch, and find the probability of the reading. (The given values are in Celsius degrees.) Between 0.25 and 1.25 Click to view page 1 of the table. LOADING... Click to view page 2 of the table. LOADING... Draw a sketch. Choose the correct graph below. A. z=0.25z=1.25 A graph with a bell-shaped curve, divided into 3 regions by 2 lines from top to bottom, both on the right side. The region between the 2 lines is shaded. Moving from left to right, the z-axis below the first line is labeled "z=0.25". The z-axis below the second line is labeled "z=1.25". B. z=0.25z=1.25 A graph with a bell-shaped curve, divided into 3 regions by 2 lines from top to bottom, both on the right side. Moving from left to right,…arrow_forwardAssume that a randomly selected subject is given a bone density test. Those test scores are normally distributed with a mean of 0 and a standard deviation of 1. Find the probability that a given score is less than 0.89 and draw a sketch of the region. Sketch the region. Choose the correct graph below. O A. -0.89 The probability is (Round to four decimal places as needed.) B. -0.89 0.89 C. A -0.89 D. 0.89arrow_forward
arrow_back_ios
arrow_forward_ios
Recommended textbooks for you
 MATLAB: An Introduction with ApplicationsStatisticsISBN:9781119256830Author:Amos GilatPublisher:John Wiley & Sons Inc
 Probability and Statistics for Engineering and th...StatisticsISBN:9781305251809Author:Jay L. DevorePublisher:Cengage Learning
 Statistics for The Behavioral Sciences (MindTap C...StatisticsISBN:9781305504912Author:Frederick J Gravetter, Larry B. WallnauPublisher:Cengage Learning
 Elementary Statistics: Picturing the World (7th E...StatisticsISBN:9780134683416Author:Ron Larson, Betsy FarberPublisher:PEARSON
 The Basic Practice of StatisticsStatisticsISBN:9781319042578Author:David S. Moore, William I. Notz, Michael A. FlignerPublisher:W. H. Freeman
 Introduction to the Practice of StatisticsStatisticsISBN:9781319013387Author:David S. Moore, George P. McCabe, Bruce A. CraigPublisher:W. H. Freeman

MATLAB: An Introduction with Applications
Statistics
ISBN:9781119256830
Author:Amos Gilat
Publisher:John Wiley & Sons Inc

Probability and Statistics for Engineering and th...
Statistics
ISBN:9781305251809
Author:Jay L. Devore
Publisher:Cengage Learning

Statistics for The Behavioral Sciences (MindTap C...
Statistics
ISBN:9781305504912
Author:Frederick J Gravetter, Larry B. Wallnau
Publisher:Cengage Learning

Elementary Statistics: Picturing the World (7th E...
Statistics
ISBN:9780134683416
Author:Ron Larson, Betsy Farber
Publisher:PEARSON

The Basic Practice of Statistics
Statistics
ISBN:9781319042578
Author:David S. Moore, William I. Notz, Michael A. Fligner
Publisher:W. H. Freeman

Introduction to the Practice of Statistics
Statistics
ISBN:9781319013387
Author:David S. Moore, George P. McCabe, Bruce A. Craig
Publisher:W. H. Freeman