MATLAB: An Introduction with Applications
6th Edition
ISBN: 9781119256830
Author: Amos Gilat
Publisher: John Wiley & Sons Inc
expand_more
expand_more
format_list_bulleted
Question

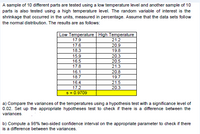
Transcribed Image Text:A sample of 10 different parts are tested using a low temperature level and another sample of 10
parts is also tested using a high temperature level. The random variable of interest is the
shrinkage that occurred in the units, measured in percentage. Assume that the data sets follow
the normal distribution. The results are as follows:
Low Temperature High Temperature
17.9
21.2
17.6
20.9
18.3
19.8
15.9
20.3
16.5
20.5
17.8
21.3
16.1
20.8
18.7
19.7
16.4
21.5
17.2
20.3
s = 0.9709
a) Compare the variances of the temperatures using a hypothesis test with a significance level of
0.02. Set up the appropriate hypotheses test to check if there is a difference between the
variances.
b) Compute a 98% two-sided confidence interval on the appropriate parameter to check if there
is a difference between the variances.
Expert Solution
This question has been solved!
Explore an expertly crafted, step-by-step solution for a thorough understanding of key concepts.
Step by stepSolved in 2 steps with 1 images

Knowledge Booster
Similar questions
- Select the correct answer below: p-value>0.10 0.05< p-value <0.10 0.01< p-value <0.05 p-value <0.01arrow_forwardA population of values has a normal distribution with 45.2 and a 67.7. You intend to draw a random sample of size n = 108. Please answer the following questions, and show your answers to 1 decimal place. Find the value separating the bottom 35% values from the top 65% values. Find the sample mean separating the bottpm 35% sample means from the top 65% sample means.arrow_forwardA population of values has a normal distribution with μ=89.6 and σ=35.2. You intend to draw a random sample of size n=32.Find P95, which is the mean separating the bottom 95% means from the top 5% means.The mean =arrow_forward
- This assignment is worth 1 points. The extra point will be added to your overall course grade. For example: if you receive an 88% in the course you can receive up to 1 point giving you a new score of 89%. The following rubric will be used. 0.25 point for drawing the normal distribution curve with the mean value labeled on the curve and the appropriate area shaded. 0.25 point for determining the value of the standard deviation of the sample mean. 0.5 point for finding the correct probability. All work must be shown in order to receive any credit. Please upload your completed assignment here. The length of time taken on the SAT for a group of students is normally distributed with a mean of 2.5 hours and a standard deviation of 0.25 hours. A sample size of n = 60 is drawn randomly from the population. Find the probability that the sample mean is between two hours and three hours.arrow_forwardGiven a normal distribution with a mean of 50 and a standard deviation of 7 assign the values to the axis below for the mean and the 3 values above and below the meanarrow_forwardA random sample of size 1,000 is taken from a population where the population proportion p = .02. What is the mean of the sample proportions?arrow_forward
- A population has a mean p= 75 and a standard deviation o= 6. Find the mean and standard deviation of a sampling distribution of sample means with sample size n= 36. (Simplify your answer.)arrow_forwardGiven a Normal Distribution with standard error of 8 from a population with a mean of 120 and a standard deviation of 48, then find the sample size (i.e. how many people or items were sampled from the population?).arrow_forwardThe following is a sample of patient's calcium tests in mg/dL. 9.3 8.8 10.1 8.9 9.4 9.8 10.0 9.9 11.2 12.1 Find each of the following: The mean: The median: The third quartile: The standard deviation: The variance:arrow_forward
- A pharmaceutical company makes tranquilizers. It is assumed that the distribution for the length of time they last is approximately normal. Researchers in a hospital used the drug on a random sample of 9 patients. The effective period of the tranquilizer for each patient (in hours) was as follows: 2.5; 2.9; 3.1; 2.3; 2.3; 2.2; 2.8; 2.1; and 2.4.arrow_forwardA farm hatches chicken eggs in batches of 15 and there is a 3% infertile rate. Find the standard deviation for the number of infertile eggs per batch. 0.2 O 0.44 0.45 O 0.66 O 43.7arrow_forwardanswer d)arrow_forward
arrow_back_ios
arrow_forward_ios
Recommended textbooks for you
 MATLAB: An Introduction with ApplicationsStatisticsISBN:9781119256830Author:Amos GilatPublisher:John Wiley & Sons Inc
 Probability and Statistics for Engineering and th...StatisticsISBN:9781305251809Author:Jay L. DevorePublisher:Cengage Learning
 Statistics for The Behavioral Sciences (MindTap C...StatisticsISBN:9781305504912Author:Frederick J Gravetter, Larry B. WallnauPublisher:Cengage Learning
 Elementary Statistics: Picturing the World (7th E...StatisticsISBN:9780134683416Author:Ron Larson, Betsy FarberPublisher:PEARSON
 The Basic Practice of StatisticsStatisticsISBN:9781319042578Author:David S. Moore, William I. Notz, Michael A. FlignerPublisher:W. H. Freeman
 Introduction to the Practice of StatisticsStatisticsISBN:9781319013387Author:David S. Moore, George P. McCabe, Bruce A. CraigPublisher:W. H. Freeman

MATLAB: An Introduction with Applications
Statistics
ISBN:9781119256830
Author:Amos Gilat
Publisher:John Wiley & Sons Inc

Probability and Statistics for Engineering and th...
Statistics
ISBN:9781305251809
Author:Jay L. Devore
Publisher:Cengage Learning

Statistics for The Behavioral Sciences (MindTap C...
Statistics
ISBN:9781305504912
Author:Frederick J Gravetter, Larry B. Wallnau
Publisher:Cengage Learning

Elementary Statistics: Picturing the World (7th E...
Statistics
ISBN:9780134683416
Author:Ron Larson, Betsy Farber
Publisher:PEARSON

The Basic Practice of Statistics
Statistics
ISBN:9781319042578
Author:David S. Moore, William I. Notz, Michael A. Fligner
Publisher:W. H. Freeman

Introduction to the Practice of Statistics
Statistics
ISBN:9781319013387
Author:David S. Moore, George P. McCabe, Bruce A. Craig
Publisher:W. H. Freeman