
MATLAB: An Introduction with Applications
6th Edition
ISBN: 9781119256830
Author: Amos Gilat
Publisher: John Wiley & Sons Inc
expand_more
expand_more
format_list_bulleted
Related questions
Concept explainers
Topic Video
Question

Transcribed Image Text:**Overview**
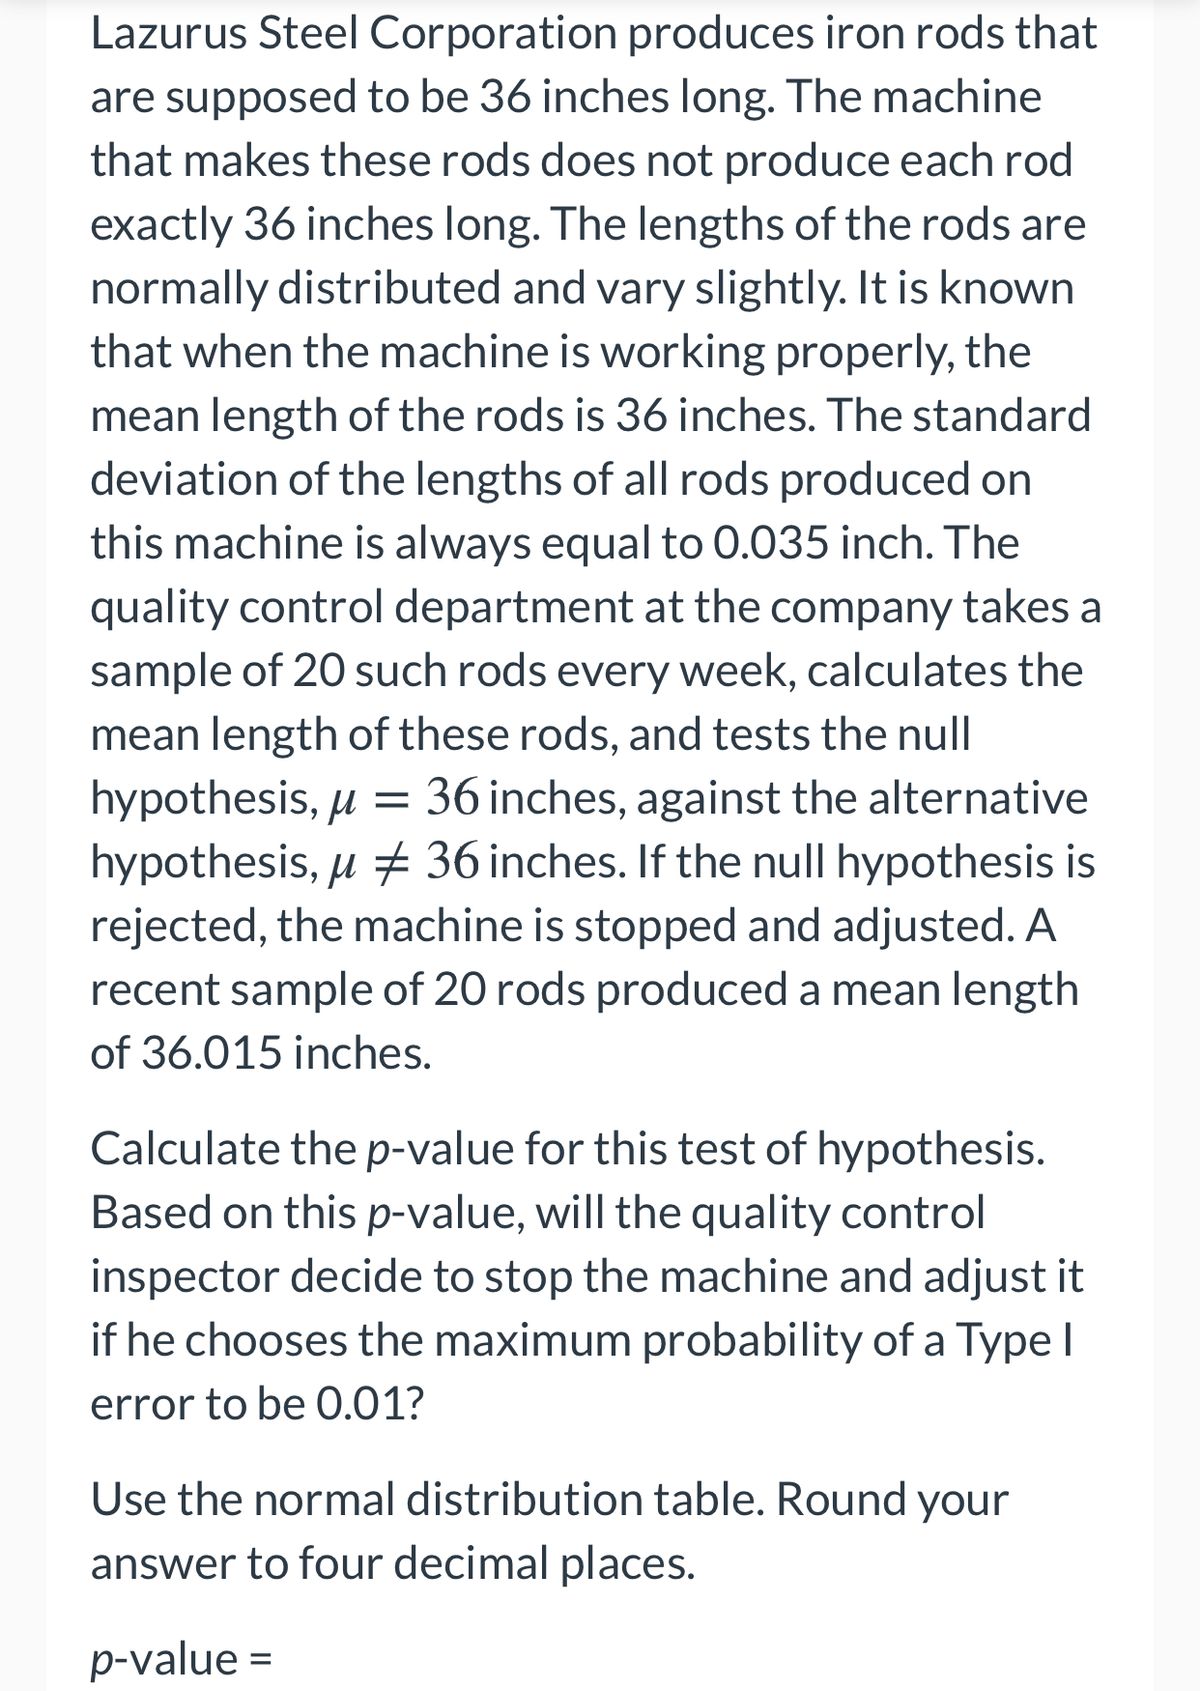
Lazurus Steel Corporation manufactures iron rods intended to be 36 inches long. However, due to variations in the manufacturing process, the exact length of each rod may differ slightly. The lengths of these rods follow a normal distribution around a mean value, with occasional deviations. To ensure quality, the mean length when the machinery operates correctly should be 36 inches, with a standard deviation of 0.035 inch.
**Quality Control Process**
- Each week, the quality control department obtains a sample of 20 rods to assess their mean length.
- The department tests the null hypothesis \( \mu = 36 \) inches against the alternative hypothesis \( \mu \neq 36 \) inches.
**Recent Observations**
- In a recent test, the sample mean length was 36.015 inches for 20 rods.
**Instruction for Analysis**
You're tasked with calculating the \( p \)-value for this hypothesis test. If the \( p \)-value suggests significant deviation from the expected mean (with a significance level \(\alpha = 0.01\)), the machinery will be halted for adjustments.
**Calculation Guidance**
- Use the normal distribution table.
- Provide the \( p \)-value rounded to four decimal places.
**Question**
Based on your \( p \)-value, should the quality control inspector adjust the machine if the threshold for Type I error probability is 0.01?
\( p \)-value = ____
(Note: Ensure you perform the calculations needed to fill in the \( p \)-value.)
![The manufacturer of a certain brand of auto batteries claims that the mean life of these batteries is 45 months. A consumer protection agency that wants to check this claim took a random sample of 24 such batteries and found that the mean life for this sample is 43.25 months. The lives of all such batteries have a normal distribution with the population standard deviation of 4.5 months.
Find the p-value for the test of hypothesis with the alternative hypothesis that the mean life of these batteries is less than 45 months.
Round your answer to four decimal places.
\[ p = \]](https://content.bartleby.com/qna-images/question/1307cdd6-2d73-4aa8-b029-858a2ce916c2/b5cff511-b5a2-4a1c-985b-68f602b73022/pf7uetq_processed.jpeg)
Transcribed Image Text:The manufacturer of a certain brand of auto batteries claims that the mean life of these batteries is 45 months. A consumer protection agency that wants to check this claim took a random sample of 24 such batteries and found that the mean life for this sample is 43.25 months. The lives of all such batteries have a normal distribution with the population standard deviation of 4.5 months.
Find the p-value for the test of hypothesis with the alternative hypothesis that the mean life of these batteries is less than 45 months.
Round your answer to four decimal places.
\[ p = \]
Expert Solution
This question has been solved!
Explore an expertly crafted, step-by-step solution for a thorough understanding of key concepts.

This is a popular solution

Trending nowThis is a popular solution!

Step by stepSolved in 2 steps with 1 images

Knowledge Booster


Learn more about
Need a deep-dive on the concept behind this application? Look no further. Learn more about this topic, statistics and related others by exploring similar questions and additional content below.Similar questions
- An agronomist measured the height of 134 canola plants. The mean height was 214 cm and the standard deviation was 16 cm. Calculate the standard error of the mean.arrow_forwardplease do questions 3 through 8 as its only related to one question!arrow_forwardAssume that we have made 10 repeated measurements of a quantity, and as a result the error assigned to the “best estimate” of the mean is 6. If we then expand our data set to a total of 20 measurements, the error in the mean will reduce to just 3. True or Falsearrow_forward
- Suppose that the mean and standard deviation for vertical jump scores are 40 and 6 cm respectively. A York student jumps 52 cm on the vertical score. Translate the student’s jump into a z-score.arrow_forwardThe distances golf balls travel under laboratory testing conditions are normally distributed. The mean is 312 yards. The probability the golf ball travels further than 319 yards is 0.28. Find the probability a randomly selected golf ball travels between 305 yards and 319 yards. Express the answer as a decimal value rounded to the nearest hundredth.arrow_forwardPlease typearrow_forward
arrow_back_ios
arrow_forward_ios
Recommended textbooks for you
- MATLAB: An Introduction with ApplicationsStatisticsISBN:9781119256830Author:Amos GilatPublisher:John Wiley & Sons Inc
 Probability and Statistics for Engineering and th...StatisticsISBN:9781305251809Author:Jay L. DevorePublisher:Cengage Learning
 Statistics for The Behavioral Sciences (MindTap C...StatisticsISBN:9781305504912Author:Frederick J Gravetter, Larry B. WallnauPublisher:Cengage Learning
  Elementary Statistics: Picturing the World (7th E...StatisticsISBN:9780134683416Author:Ron Larson, Betsy FarberPublisher:PEARSON
 The Basic Practice of StatisticsStatisticsISBN:9781319042578Author:David S. Moore, William I. Notz, Michael A. FlignerPublisher:W. H. Freeman
 Introduction to the Practice of StatisticsStatisticsISBN:9781319013387Author:David S. Moore, George P. McCabe, Bruce A. CraigPublisher:W. H. Freeman
MATLAB: An Introduction with Applications
Statistics
ISBN:9781119256830
Author:Amos Gilat
Publisher:John Wiley & Sons Inc
Probability and Statistics for Engineering and th...
Statistics
ISBN:9781305251809
Author:Jay L. Devore
Publisher:Cengage Learning
Statistics for The Behavioral Sciences (MindTap C...
Statistics
ISBN:9781305504912
Author:Frederick J Gravetter, Larry B. Wallnau
Publisher:Cengage Learning
Elementary Statistics: Picturing the World (7th E...
Statistics
ISBN:9780134683416
Author:Ron Larson, Betsy Farber
Publisher:PEARSON
The Basic Practice of Statistics
Statistics
ISBN:9781319042578
Author:David S. Moore, William I. Notz, Michael A. Fligner
Publisher:W. H. Freeman
Introduction to the Practice of Statistics
Statistics
ISBN:9781319013387
Author:David S. Moore, George P. McCabe, Bruce A. Craig
Publisher:W. H. Freeman