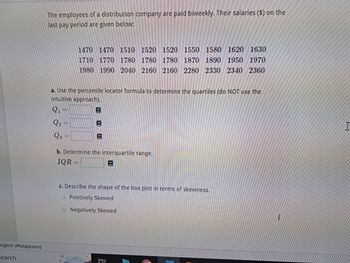

The first quartile Q1 is the 25th percentile The first quartile Q1 is the median of the lower half not including the value of Q2. data values less than the position of the median are
Because there are an odd numbers,so one middle number is = 1580
The second quartile Q2 is the 50th percentile The second quartile Q2 =median=middle number in a sorted data set If there are an odd number of data values, the median is a single number otherwise we take average of the two middle numbers. Since there is an odd number total 27 of data values in this data set, there is only one middle number 14 th value, Therefore, the median is 1780
The third quartile Q3 is the 75th percentile The third quartile Q3 is the median of the upper half not including the value of Q2. data values greater than the position of the median are
1870 , 1890 , 1950 , 1970 , 1980 , 1990 , 2040 , 2160 , 2160 , 2280 , 2330 , 2340 , 2360 ,
Because there are an odd numbers,so one middle number is =2040
Q1 = 1st quartile: 1580
Q2 = Median: 1780
Q3=3rd quartile: 2040
Step by stepSolved in 2 steps with 1 images

- Use the following cell phone airport data speeds (Mbps) from a particular network. Find the percentile corresponding to the data speed 0.9 Mbps. Percentile of 0.9 equals (Round to the nearest whole number as needed.)arrow_forwardUse the box-and-whisker plot to identify the five-number summary. Min = Q₁ = Q₂: = = Max = 936 1286 900 1200 1503 1500 1800 2086 1985 2100 Qarrow_forwardDescribe the shape of the data presented: 40.0% 35.0% 30.0% 25.0% 20.0% 15.0% 10.0% 5.0% 0.0% 36.1% 24.5% Ethnicity of Students Skewed to the right Skewed to the left Symmetric None of the above 17.1% 9.6% Asian White Hispanic Other/ Unknown 5.8% 5.3% Black Filipino 1.0% 0.6% Pacific Native Islander Americanarrow_forward
- Use this data which give the dosage levels for a particular drug and the heart rate measured 30 minutes after taking the drug. Dose (mg) Heart rate 0.125 95 0.20 90 0.25 93 0.30 92 0.35 88 0.40 80 0.50 82 Create a scatter plot. Use your Ti-84arrow_forwardUsing the following stem & leaf plot, find the five number summary for the data. 0 2 3 4 4 5 9 3 4 2 2 79 0 45 6 89 6 0 8 Min = Q1 Med = Q3 = %3D Max =arrow_forwardThe following data are the maximum temperatures (in degrees Fahrenheit) of 17 cities in the United states measured on the same day. 53 70 65 74 85 76 84 70 61 59 54 66 56 71 81 73 76 Construct a box and whisker plot for the data.arrow_forward
- Use the stem-and-leaf plot to list the actual data entries. What is the maximum data entry? What is the minimum data entry? Key: 2 | 7=27 27 3 2 4 1224779 5 011233 3 4 4 4 4 56 689 6 999 7 399 8 5 Choose the correct actual data entries below. O A. 27, 32, 41, 42, 42, 44, 47, 47, 49, 50, 51, 51, 52, 53, 53, 53, 54, 54, 54, 54, 55, 56, 56, 58, 59, 69, 69, 69, 73, 79, 79, 85 B. 27, 32, 41, 42, 44, 47, 49, 50, 51, 52, 53, 54, 55, 56, 58, 59, 69, 73, 79, 85 OC. 2.7, 3.2, 4.1, 4.2, 4.4, 4.7, 4.9, 5.0, 5.1, 5.2, 5.3, 5.4, 5.5, 5.6, 5.8, 5.9,6.9, 7.3, 7.9, 8.5 O D. 2.7, 3.2, 4.1, 4.2, 4.2, 4.4, 4.7, 4.7, 4.9, 5.0, 5.1, 5.1, 5.2, 5.3, 5.3, 5.3, 5.4, 5.4, 5.4, 5.4, 5.5, 5.6, 5.6, 5.8, 5.9, 6.9, 6.9, 6.9, 7.3, 7.9, 7.9, 8.5 The maximum data entry is The minimum data entry isarrow_forward(6) Below is the exam score for 11 students: 90, 83, 89, 66, 80, 87, 95, 94, 70, 92, 83 Construct a stem-and-leaf plot for the data set, using the tenth digit as the stem and the unit digit as the leaf.arrow_forwardUsing the following stem & leaf plot, find the five number summary for the data. View in full window so that you have 6 rows of data. 1 02 2 m 34459 4 2279 5 0 4 5 6 8 9 6 08 Min = Q₁² Med = Q3 Max = ▬▬▬▬arrow_forward
 MATLAB: An Introduction with ApplicationsStatisticsISBN:9781119256830Author:Amos GilatPublisher:John Wiley & Sons Inc
 Probability and Statistics for Engineering and th...StatisticsISBN:9781305251809Author:Jay L. DevorePublisher:Cengage Learning
 Statistics for The Behavioral Sciences (MindTap C...StatisticsISBN:9781305504912Author:Frederick J Gravetter, Larry B. WallnauPublisher:Cengage Learning
 Elementary Statistics: Picturing the World (7th E...StatisticsISBN:9780134683416Author:Ron Larson, Betsy FarberPublisher:PEARSON
 The Basic Practice of StatisticsStatisticsISBN:9781319042578Author:David S. Moore, William I. Notz, Michael A. FlignerPublisher:W. H. Freeman
 Introduction to the Practice of StatisticsStatisticsISBN:9781319013387Author:David S. Moore, George P. McCabe, Bruce A. CraigPublisher:W. H. Freeman


