FINANCIAL ACCOUNTING
10th Edition
ISBN: 9781259964947
Author: Libby
Publisher: MCG
expand_more
expand_more
format_list_bulleted
Question

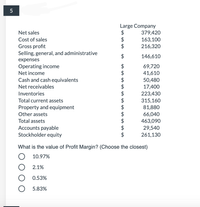
Transcribed Image Text:Large Company
$
$
$
Net sales
379,420
Cost of sales
163,100
216,320
Gross profit
Selling, general, and administrative
146,610
expenses
Operating income
69,720
41,610
Net income
Cash and cash equivalents
50,480
17,400
Net receivables
Inventories
$
223,430
315,160
81,880
66,040
463,090
Total current assets
Property and equipment
Other assets
Total assets
Accounts payable
Stockholder equity
$
$
29,540
261,130
What is the value of Profit Margin? (Choose the closest)
10.97%
2.1%
0.53%
5.83%

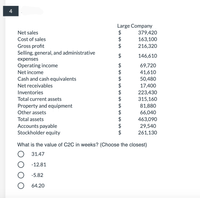
Transcribed Image Text:Large Company
$
Net sales
379,420
163,100
216,320
Cost of sales
Gross profit
Selling, general, and administrative
$
146,610
expenses
Operating income
$
69,720
Net income
41,610
50,480
Cash and cash equivalents
Net receivables
17,400
Inventories
223,430
315,160
Total current assets
Property and equipment
81,880
Other assets
66,040
Total assets
463,090
29,540
Accounts payable
Stockholder equity
261,130
What is the value of C2C in weeks? (Choose the closest)
31.47
-12.81
-5.82
64.20
4.
Expert Solution
This question has been solved!
Explore an expertly crafted, step-by-step solution for a thorough understanding of key concepts.
This is a popular solution
Trending nowThis is a popular solution!
Step by stepSolved in 2 steps

Knowledge Booster
Learn more about
Need a deep-dive on the concept behind this application? Look no further. Learn more about this topic, accounting and related others by exploring similar questions and additional content below.Similar questions
- Vertical Analysis of Balance Sheet Balance sheet data for Kwan Company on December 31, the end of two recent fiscal years, follow: Current Year Previous Year Current assets $300,300 $186,760 Property, plant, and equipment 446,160 392,840 Intangible assets 111,540 64,400 Current liabilities 163,020 90,160 Long-term liabilities 368,940 270,480 Common stock 68,640 77,280 Retained earnings 257,400 206,080 Prepare a comparative balance sheet for both years, stating each asset as a percent of total assets and each liability and stockholders' equity item as a percent of the total liabilities and stockholders' equity. If required, round percentages to one decimal place.arrow_forwardSales revenue HK$112,000 Gain on sale of plant assets 33,600 Selling and administrative expenses 11,200 Cost of goods sold 61,600 Interest expense 5,600 Income tax rate 20 % Determine (a) Income from operations HK$enter a hong kong dollar amountarrow_forwardCondensed financial data are presented below for the Phoenix Corporation: 20X2 20X1 Accounts receivable $ 267,500 $ 230,000 Inventory 312,500 257,500 Total current assets 670,000 565,000 Intangible assets 50,000 60,000 Total assets 825,000 695,000 Current liabilities 252,500 200,000 Long-term liabilities 77,500 75,000 Sales 1,640,000 Cost of goods sold 982,500 Interest expense 10,000 Income tax expense 77,500 Net income 127,500 Cash flow from operations 71,000 Cash flow from investing activities (6,000 ) Cash flow from financing activities (62,500 ) Tax rate 30 % If there is no preferred stock, the return on common equity for 20X2 is (rounded): Multiple Choice 25.8% 27.9% 41.4% 43.4%arrow_forward
- Current assets Cash Accounts receivable Inventory Total Net plant and equipment Total assets Current assets Cash Assets Fixed assets 2017 $ 10,200 30,200 74,600 $ 115,000 Accounts receivable Inventory Total $285,000 $400,000 Assets 2018 Net plant and equipment $ 13,200 38,640 87,120 $ 138,960 $ 341,040 $480,000 $ $ $ 2017 Current liabilities For each account on this company's balance sheet, show the change in the account during 2018 and note whether this change was a source or use of cash. (If there is no action select "None" from the dropdown options. Leave no cells blank - be certain to enter "0" wherever required. A negative answer should be indicated by a minus sign.) Accounts payable Notes payable Total Long-term debt Owners' equity Common stock and paid-in Retained earnings surplus Liabilities and Owners' Equity 2017 Total 10,2003 30,200 74,600 115,000 Total liabilities and owners' equity 285,000 Sources/Uses $ $ $ $ 46,000 27,800 $ 73,800 $ 40,000 $ 60,000 226,200 $286,200…arrow_forwardQuestion: Vertical Analysis of the Income statement Company A Company B Net sales 2,300,000 300,000 Cost of goods sold 1,100,000 200,000 Gross profit 1,200,000 100,000 Operating Expenses: Administrative expenses 120,000 20,000 Marketing expenses 220,000 30,000 Research and Development 500,000 10,000 Total Operating expenses 840,000 60,000 Interest expense 200,000 10,000 Net income 160,000 30,000 Required: Prepare a vertical analysis of these two companies. Compare and contrast the financial situation of these two companies assuming that they are in the same industry. Discuss fully.arrow_forwardInstructions This assignment is designed for practicing both the retailer/merchandiser accounting cycle and your basic excel skills. Below are select sales transactions for two companies. You will need to enter the missing pieces of each transaction on the journal entry tab. Each missing piece of information is highlighted in yellow. The only cell where an actual number is to be input is on the journal entries worksheet. Please note: not every yellow cell requires input (it could be left blank if appropriate). After completing the journal entries, you must then complete the missing pieces of the T accounts, trial balance, and statements highlighted in yellow. Only excel functions may be used to calculate the appropriate cell value on these pages. DO NOT INPUT THE ACTUAL NUMBER INTO THE T ACCOUNTS, TRIAL BALANCE, OR STATEMENTS. Use excel functions (such as making a cell equal another from the journal entry page, summing numbers together, or using the plus or minus symbols to help you…arrow_forward
- MONTGOMERY INC.Comparative Balance SheetsDecember 31 Current Year Prior Year Assets Cash $ 30,800 $ 31,000 Accounts receivable, net 8,900 10,900 Inventory 79,800 63,000 Total current assets 119,500 104,900 Equipment 44,200 37,300 Accum. depreciation—Equipment (19,900 ) (13,800 ) Total assets $ 143,800 $ 128,400 Liabilities and Equity Accounts payable $ 21,200 $ 22,900 Salaries payable 400 500 Total current liabilities 21,600 23,400 Equity Common stock, no par value 102,400 94,100 Retained earnings 19,800 10,900 Total liabilities and equity $ 143,800 $ 128,400 MONTGOMERY INC.Income StatementFor Current Year Ended December 31…arrow_forwardBurch Company Income Statement For the year ended December 31 Sales $250,000 Cost of goods sold (160,000) Depreciation expense (26,400) Other expenses (35,000) Income tax expense (12,000) Net income $16,600 Required: Compute the net cash flows from operating activities using the indirect method. 33,200 Xarrow_forwardSelling & administrative expenses 20,200 Loss on sale of plant assets 11,700 Gross profit 90,500 Interest expense 8,000 Income tax 10,000 Rent revenue 10,200 If this information was used to prepare an income statement, Income from Operations should be: Select one: a. 68,800 b. 70,300 c. 78,800 d. 110,700 e. 58,600arrow_forward
- Clean Company Balance Sheet Cash 68,200 Accounts payable 113,500 Accounts 295,000 Notes payable 73,900 receivable Other current Inventories 212,000 101,000 liabilities Total Current Total Current 575,200 288,400 assets liabilities PP&E Net 257,400 Long-term debt 226,500 Total Equity 317,700 Total Liabilities + Total Assets 832,600 832,600 Equity Clean Company Income Statement Sales $1,414,600 Cost of sales 1,190,640 Gross profit 223,960 Operating expenses 125,840 Depreciation 36,520 EBIT 61,600 Interest expenses 21,560 Earnings before 40,040 taxes Taxes (40%) 16,016 Net profit 24,024arrow_forwardThe following information pertains to Peak Heights Company: Income Statement for Current Year Sales $ 85,300 Expenses Cost of goods $ sold 51,675 Depreciation 8,100 expense Salaries 12,000 71,775 expense Net income $ 13,525 Partial Balance Prior Sheet Current year year Accounts $ $ 9,900 receivable 14,400 Inventory 13,700 8,300 Salaries payable 1,550 850 Required: Present the operating activities section of the statement of cash flows for Peak Heights Company using the indirect method. Note: List cash outflows as negative amounts. PEAK HEIGHTS COMPANY Statement of Cash Flows (Partial) Cash flows from operating activities: Accounts receivable increasearrow_forwardBreanna Inc. Accounts receivable$10,700Accumulated depreciation 50,800Cost of goods sold 123,000Income tax expense 8,000Cash 62,000Net sales 201,000Equipment 128,000Selling, general, and administrative expenses 32,000Common stock (8,700 shares) 90,000Accounts payable 14,300Retained earnings, 1/1/19 30,000Interest expense 5,600Merchandise inventory 38,600Long-term debt 38,000Dividends declared and paid during 2019 16,200 Item1 Time Remaining 2 hours 32 minutes 36 seconds 02:32:36 Item 1 Time Remaining 2 hours 32 minutes 36 seconds 02:32:36 The information on the following page was obtained from the records of Breanna Inc.: Accounts receivable $ 10,700 Accumulated depreciation 50,800 Cost of goods sold 123,000 Income tax expense 8,000 Cash 62,000 Net sales 201,000 Equipment 128,000 Selling, general, and administrative expenses 32,000 Common stock (8,700 shares) 90,000 Accounts payable 14,300 Retained earnings, 1/1/19…arrow_forward
arrow_back_ios
SEE MORE QUESTIONS
arrow_forward_ios
Recommended textbooks for you

 AccountingAccountingISBN:9781337272094Author:WARREN, Carl S., Reeve, James M., Duchac, Jonathan E.Publisher:Cengage Learning,
 Accounting Information SystemsAccountingISBN:9781337619202Author:Hall, James A.Publisher:Cengage Learning,
 Horngren's Cost Accounting: A Managerial Emphasis...AccountingISBN:9780134475585Author:Srikant M. Datar, Madhav V. RajanPublisher:PEARSON
 Intermediate AccountingAccountingISBN:9781259722660Author:J. David Spiceland, Mark W. Nelson, Wayne M ThomasPublisher:McGraw-Hill Education
 Financial and Managerial AccountingAccountingISBN:9781259726705Author:John J Wild, Ken W. Shaw, Barbara Chiappetta Fundamental Accounting PrinciplesPublisher:McGraw-Hill Education


Accounting
Accounting
ISBN:9781337272094
Author:WARREN, Carl S., Reeve, James M., Duchac, Jonathan E.
Publisher:Cengage Learning,

Accounting Information Systems
Accounting
ISBN:9781337619202
Author:Hall, James A.
Publisher:Cengage Learning,

Horngren's Cost Accounting: A Managerial Emphasis...
Accounting
ISBN:9780134475585
Author:Srikant M. Datar, Madhav V. Rajan
Publisher:PEARSON

Intermediate Accounting
Accounting
ISBN:9781259722660
Author:J. David Spiceland, Mark W. Nelson, Wayne M Thomas
Publisher:McGraw-Hill Education

Financial and Managerial Accounting
Accounting
ISBN:9781259726705
Author:John J Wild, Ken W. Shaw, Barbara Chiappetta Fundamental Accounting Principles
Publisher:McGraw-Hill Education