
MATLAB: An Introduction with Applications
6th Edition
ISBN: 9781119256830
Author: Amos Gilat
Publisher: John Wiley & Sons Inc
expand_more
expand_more
format_list_bulleted
Related questions
Question

Transcribed Image Text:g
known
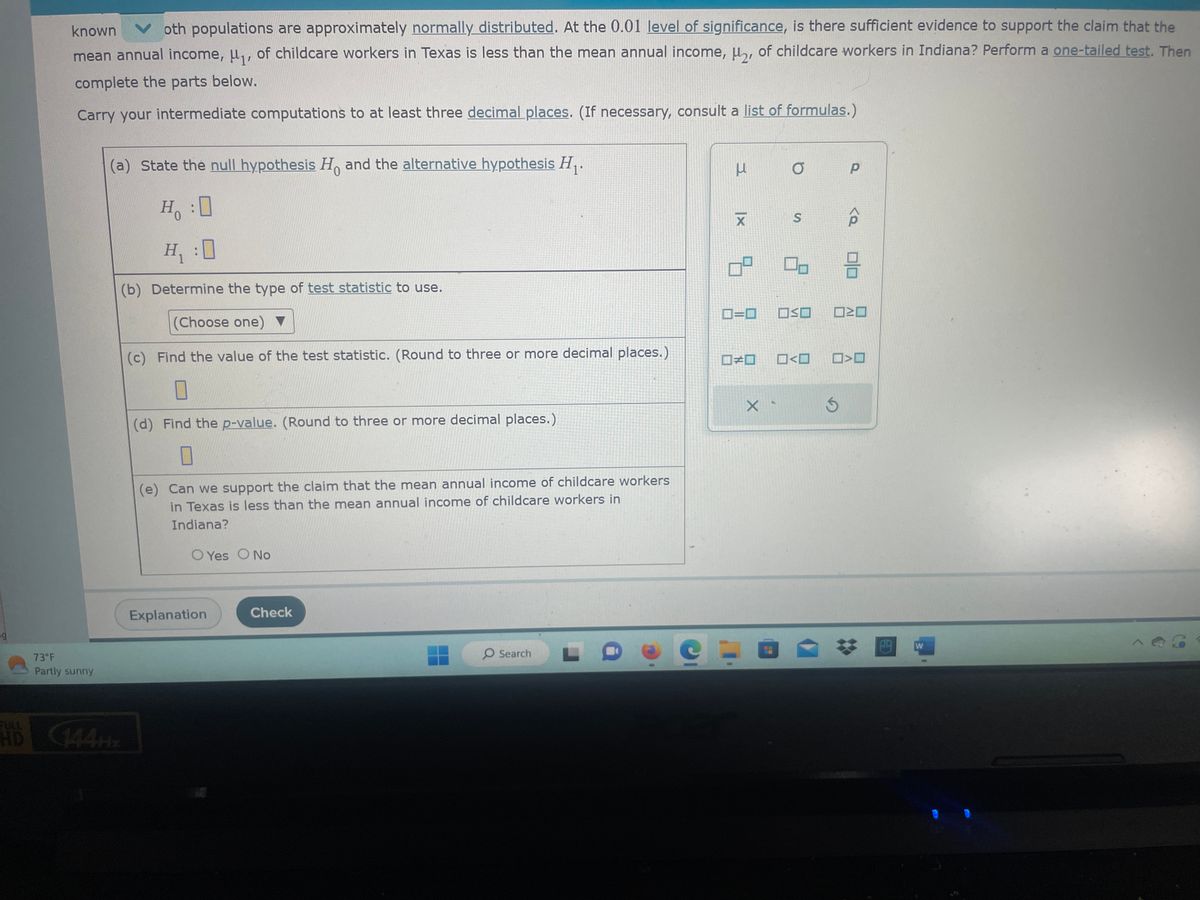
oth populations are approximately normally distributed. At the 0.01 level of significance, is there sufficient evidence to support the claim that the
mean annual income, μ₁, of childcare workers in Texas is less than the mean annual income, μ₂, of childcare workers in Indiana? Perform a one-tailed test. Then
complete the parts below.
Carry your intermediate computations to at least three decimal places. (If necessary, consult a list of formulas.)
73°F
Partly sunny
(a) State the null hypothesis Ho and the alternative hypothesis H₁.
Ho : :0
H₁:0
(b) Determine the type of test statistic to use.
(Choose one) ▼
(c) Find the value of the test statistic. (Round to three or more decimal places.)
0
(d) Find the p-value. (Round to three or more decimal places.)
0
FULL
HD 144HZ
(e) Can we support the claim that the mean annual income of childcare workers
in Texas is less than the mean annual income of childcare workers in
Indiana?
O Yes O No
Explanation
Check
O Search
C
I
X
5
ローロ
#
X-
P
O
S
Do
SO
□<口
Р
<Q
010
>
W

Transcribed Image Text:Pag
73°F
Partly sunny
A nationwide job recruiting firm wants to compare the annual incomes for childcare workers in Texas and Indiana. Due to recent trends in the childcare industry,
the firm suspects that the mean annual income of childcare workers in Texas is less than the mean annual income of childcare workers in Indiana. To see if this
is true, the firm selected a random sample of 10 childcare workers from Texas and an independent random sample of 10 childcare workers from Indiana and
asked them to report their mean annual income. The data obtained were as follows.
Annual income in dollars
Texas 35102, 40287, 32854, 29080, 36394, 22024, 22493, 31602, 27434, 40040
Indiana 38446, 33018, 38027, 43504, 37962, 33838, 35730, 36793, 37714, 25715
HD 144Hz
Send data to calculator V
The population standard deviation for the annual incomes of childcare workers in Texas and in Indiana are estimated as 6200 and 6500, respectively. It is also
known that both populations are approximately normally distributed. At the 0.01 level of significance, is there sufficient evidence to support the claim that the
mean annual income, H₁, of childcare workers in Texas is less than the mean annual income, μ₂, of childcare workers in Indiana? Perform a one-tailed test. Then
complete the parts below.
Send data to Excel
Carry your intermediate computations to at least three decimal places. (If necessary, consult a list of formulas.)
h
(a) State the null hypothesis Ho and the alternative hypothesis H₁.
H:0
H₁:0
(b) Determine the type of test statistic to use.
Explanation
Check
O Search
н
|x
X
O
S
Р
<Q
8
AD
W
E
Expert Solution
This question has been solved!
Explore an expertly crafted, step-by-step solution for a thorough understanding of key concepts.

Step by stepSolved in 2 steps with 1 images

Knowledge Booster

Similar questions
- rength of concrete: The compressive strength, in kilopascals, was measured for concrete blocks from five different batches of concrete, both three and six days after pouring. The data are as follows. Can you conclude that the mean strength after three days differs from the mean strength after six days? Let H, represent the mean strength after three days and P =H, -P. Use the a=0.01 level and the P-value method with the TI-84 Plus calculator. Block 1 4 After 3 days 1317 1363 1321 1333 1311 After 6 days 1382 1341 1327 1342 1386 Send data to Excel Part 1 of 4 (a) State the null and alternate hypotheses. H: This hypothesis test is a (Choose one) v test. Part 2 of 4 (b) Compute the P-value. Round the answer to at least four decimal places. P-value = Part 3 of 4 Determine whether to reject Ho. (Choose one) v the null hypothesis. Part 4 of 4 (c) State a conclusion. There (Choose one) v enough evidence to conclude that the mean strength after three days differs from the mean strength after six…arrow_forward6arrow_forwardA survey of 100 senior citizens was undertaken and it was found that 9 of them had the flu vaccine this year. Do these data suggest that the proportion of senior citizens who get the flu vaccine is significantly less than 12 % ? Test at a = 0.10. Round your answers to three decimal places, and round any interim calculations to four decimal places. What is the test statistic? Hint: Make sure you are rounding your answer to three decimal places. 0.923 X Using your answer from the previous question, find the p-value. What is the critical value for this test? Part 2arrow_forward
- K Assume that adults have IQ scores that are normally distributed with a mean of 99 and a standard deviation 19.3. Find the first quartile Q₁, which is the IQ score separating the bottom 25% from the top 75%. (Hint: Draw a graph.) The first quartile is. (Type an integer or decimal rounded to one decimal place as needed.)arrow_forwardHo;p=0.77 H1;p>077 your sample consists of 136 subjects, with 100 sucesses calculate the t statistics rounded to 2 decimal placesarrow_forwardCan you help me calculate the statistic and p-value for the following equation?arrow_forward
- I need help with part 4 and 5. Part 5. (e)State a conclusion. Use the a= 0.10 level of significance. There is/ is not enough evidence to conclude that the mean FEV1 in the high-pollution community is less/more than 2.1 liters.arrow_forwardme of a CIA agent is greater than $81,623 (based on data from payscale.com) given that the test statistic is t = 1 20 for a sample of 40 CIA agents. 4. P-Value Find the P-value in a test of the claim that the mean annual 1.304arrow_forwardNeed help with this question.arrow_forward
- mg mg Calcium levels in people are normally distributed with a mean of 9.5 and a standard deviation of 0.3 dL dL Individuals with calcium levels in the bottom 15% of the population are considered to have low calcium levels. Find the calcium level that is the borderline between low calcium levels and those not considered low. Carry your intermediate computations to at least four decimal places. Round your answer to one decimal place. mg dL Xarrow_forwardYou want to obtain a sample to estimate a population mean. Based on previous evidence, you believe the population standard deviation is approximately o = 74.4. You would like to be 90% confident that your estimate is within 4 of the true population mean. How large of a sample size is required? n=arrow_forwardcan you answer part b? ( please the answer is not 1.915 so can you solve correctly? )arrow_forward
arrow_back_ios
SEE MORE QUESTIONS
arrow_forward_ios
Recommended textbooks for you
- MATLAB: An Introduction with ApplicationsStatisticsISBN:9781119256830Author:Amos GilatPublisher:John Wiley & Sons Inc
 Probability and Statistics for Engineering and th...StatisticsISBN:9781305251809Author:Jay L. DevorePublisher:Cengage Learning
 Statistics for The Behavioral Sciences (MindTap C...StatisticsISBN:9781305504912Author:Frederick J Gravetter, Larry B. WallnauPublisher:Cengage Learning
  Elementary Statistics: Picturing the World (7th E...StatisticsISBN:9780134683416Author:Ron Larson, Betsy FarberPublisher:PEARSON
 The Basic Practice of StatisticsStatisticsISBN:9781319042578Author:David S. Moore, William I. Notz, Michael A. FlignerPublisher:W. H. Freeman
 Introduction to the Practice of StatisticsStatisticsISBN:9781319013387Author:David S. Moore, George P. McCabe, Bruce A. CraigPublisher:W. H. Freeman
MATLAB: An Introduction with Applications
Statistics
ISBN:9781119256830
Author:Amos Gilat
Publisher:John Wiley & Sons Inc
Probability and Statistics for Engineering and th...
Statistics
ISBN:9781305251809
Author:Jay L. Devore
Publisher:Cengage Learning
Statistics for The Behavioral Sciences (MindTap C...
Statistics
ISBN:9781305504912
Author:Frederick J Gravetter, Larry B. Wallnau
Publisher:Cengage Learning
Elementary Statistics: Picturing the World (7th E...
Statistics
ISBN:9780134683416
Author:Ron Larson, Betsy Farber
Publisher:PEARSON
The Basic Practice of Statistics
Statistics
ISBN:9781319042578
Author:David S. Moore, William I. Notz, Michael A. Fligner
Publisher:W. H. Freeman
Introduction to the Practice of Statistics
Statistics
ISBN:9781319013387
Author:David S. Moore, George P. McCabe, Bruce A. Craig
Publisher:W. H. Freeman